Gaming analytics: Why the numbers matter

Gaming is inescapable. Your aunt is crushing candy on the subway ride to work, while your cousin is fighting tooth and nail to earn their very first battle royale on Fortnite. And the numbers prove it, too.
The League of Legends World Championships 2023 raked in a record-shattering 6.4 million concurrent viewers across its 116-hour air time – and that’s excluding Chinese viewership. Gaming has become more than just a source of entertainment – it’s social, educational, and even cultural.
But behind this immersive experience, the engine powering the growth is gaming analytics. Human creativity paired with exceptional data produces incredible games.
But how exactly can data do that? Read on to find out more about what data tells us and how it empowers game developers to make smarter decisions.
What is gaming analytics?
Gaming analytics is the data and insights that help improve decision making in game design, monetization, game experience, and business growth. The right data, when interpreted properly, provides the science to improve games. With accurate and actionable data, you can listen to your customers at a deeper level, rather than relying on guesstimates and gut feel.
While mobile gaming analytics has made incredible strides, PC and console gaming have come a long way, too. Here’s a quick rundown of how data plays into every aspect of gaming today.

Player behavior: understand where gamers spend the most time, or where they drop off, to improve engagement.
Monetization: identify patterns of behavior that lead more players to purchases or monetization events.
Predictive growth: find and close gaps in gaming and advertising to increase player engagement and growth.
Marketing attribution: discover which campaigns are the most effective across multiple advertising platforms.
Why is gaming analytics important?
Gaming analytics helps improve every aspect of your game, from advertising to gameplay. When used correctly, data analytics helps games become more fun, reducing churn and keeping your game profitable.
Here are a few more ways gaming analytics can help:
- Improve user experience, including personalized advertising, and balance in-game ecosystems
- Improve retention, using data to make particular elements of the game better
- Optimize ad campaigns and attribute campaigns across multiple channels
- Measure key performance indicators (KPIs) that impact your bottom line, such as ROAS, ROI, and LTV
How to implement gaming analytics
Just like Mario, there are levels to gaming analytics. The very best place to start is by asking three key questions:
- Acquisition: How many people have installed my game?
- Retention: How many people are playing my game?
- Monetization: How much money is my game generating?
Answering these three questions allows you to decide which metrics are important for your game, and which will be the most impactful in the long run, within your budget of course.
While these high-level metrics may be fairly simple to report, digging deeper can prove more of a challenge — but the rewards are worth it. Here are some tips to help you implement gaming analytics effectively.

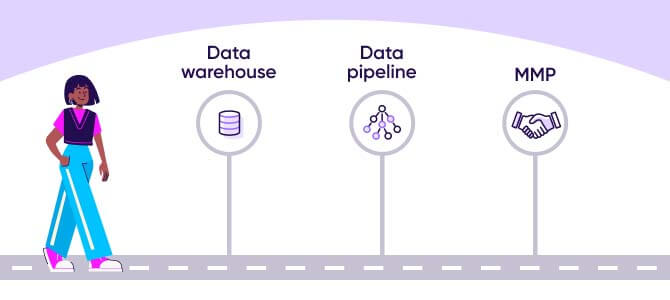
Start with a data warehouse
The foundation of gaming analytics is built on a solid data warehouse, which today is mostly cloud-based, allowing developers to retain and share data more effectively. The primary jobs of a warehouse are to manage large amounts of data, analyze and enrich the data, and maintain privacy and regulatory compliance.
The major data warehouses include Google BigQuery, Oracle Data Warehouse, Amazon Redshift, and Snowflake.
Set up a data pipeline
Now you’ll need to find a way to get your data to flow between your data sources and your data warehouse. There are multiple tech solutions, like AWS or Azure, to help you build a pipeline to ingest, store, and analyze data.
Find a mobile measurement partner
To top it all off, a mobile measurement partner (MMP) helps connect the dots across different channels – whether it’s PC, console, mobile or all three at once. An MMP is also key in measuring post-conversion behavior, like in-game purchases, ultimately gathering your whole ad media budget across multiple platforms, devices, and channels in one place.
What KPIs should you measure?
When it comes to measurement, it’s all too easy to get tangled in the jungle of marketing acronyms. Here’s a refresher on all the KPIs (key performance indicators) you need to know, divided into three key groups.
Monetization KPIs
Money makes the world go round! So let’s start with the monetization KPIs you should be familiar with.
ARPU: Average revenue per user
Formula: ARPU = Total revenue / Total number of users
ARPU provides a simple, high-level overview that serves as a starting point of how profitable your game is. However, whales (your biggest spenders) and extremely frugal players can skew the data and won’t paint the whole picture.
ARPPU: Average revenue per paying user
ARPPU measures the average amount of revenue generated by each user who has made an in-app purchase, microtransaction, or app purchase within a time frame (typically one month).
Formula: ARPPU = Total revenue / Total number of paying users
ARPPU measures the effectiveness of your game’s monetization strategy by segmenting out gamers who typically wouldn’t spend in a game at all. A higher ARPPU can indicate a much more profitable game, compared to the alternative.
ARPDAU: Average revenue per daily active user
ARPDAU measures the average revenue generated by each daily active user within a specified time period. It’s most commonly measured on a daily basis to understand how much revenue each player generates day-to-day.
Formula: ARPDAU = Total revenue / Number of daily active users
ARPDAU is most effective when looking at day-to-day performance that may be affected by short-term changes, in-game promotions, or advertising campaigns, all of which can impact player revenue.
LTV: Lifetime value
LTV measures the revenue a player is expected to generate over their entire “lifetime” with the game.
Formula: LTV = ARPU x Average lifespan of a player
LTV helps game developers, publishers, and advertisers to think about the long-term value of acquiring new players and retaining existing players. When LTV is higher than the cost to acquire a new player (also known as customer acquisition cost or CAC), the game is en route to be profitable over the long term.
ATV: Average transaction value
ATV measures the average amount a player spends on each transaction within a time frame.
Formula: ATV = Total revenue / Number of transactions
ATV can be an indicator of the value of in-game purchases or how players justify spending within a game. A lower ATV could correlate with lower retention rates, and also hint at how the game is positioned against its competitors.
Engagement KPIs
Next up, let’s cover engagement KPIs, or data that measures player behavior.
DAU: Daily active users
DAU measures the number of unique players engaging with a game on a daily basis.
Formula: DAU = Number of unique users / Day
DAU is a high-level metric that keeps a pulse on a game’s player base. It’s most effective when measured over longer time frames. For multiplayer games, DAU is crucial to ensure there’s a vibrant player base to improve matchmaking, build player-to-player interaction, and encourage a competitive environment.
MAU: Monthly active users
MAU measures the number of unique players engaging with a game on a monthly basis.
Formula: MAU = Number of unique users / Month
MAU can help identify long-term trends in user engagement, especially for games that have been around for a longer period of time. A high MAU suggests a sustained, vibrant, and active player base with high user retention.
Stickiness
This measures how well your game retains players and keeps them coming back over time.
Formula: Stickiness = Daily active users / Monthly active users
Stickiness can be measured by analyzing a wealth of metrics, including DAU, MAU, WAU (weekly active users), retention rates, session lengths, churn, and frequency of sessions. However, the simplest way to measure it is by dividing DAU by MAU, which shows the proportion of players who return to your game within a given month.

Retention rate
This measures the proportion of players who play your game over a specific time period without dropping off. It’s often shown as a percentage.
Formula: Retention rate = Number of active players / Total number of active players at the beginning of time period
In short, retention rate is a high-level metric that indicates how many players continuously play a game. In comparison, stickiness is more specific, indicating how gamers engage with a game over a time period.
Churn rate
This measures the percentage of players who stop playing a game over a specific period of time.
Formula: Churn rate = Number of players who left / Monthly users x 100
Churn rate is the opposite of retention rate, measuring how fast you’re losing players. A high churn rate may be linked to a game’s complexity, lack of new content, repetitive tasks, poor gaming experiences, new competitors, or friends that quit playing. Overall, churn rate is the first red flag indicator that will prompt gaming companies to dig deeper into their data and see what’s causing the leak.
Session length
This measures the average amount of time a player spends in one gaming session.
Formula: Session length = Total hours of play / Time period
This is a straightforward metric that helps indicate how captivating and engaging a game is, where higher session lengths can indicate a healthy gaming experience.
In-game KPIs
Last but not least, in-game KPIs help game developers make informed decisions about game design, including difficulty, balance, and playability.
Start, fail, complete
Start is the beginning of a level or mission. Fail indicates when a player is unable to successfully complete a level or mission. Complete indicates a player successfully accomplishing the task, mission, or level.
Measuring these three metrics can identify which levels are too easy and which are too difficult, allowing developers to optimize difficulty, especially where it’s negatively affecting retention.

Sources and sinks
Sources and sinks are the two key components of an in-game economy.
Sources are the mechanisms and activities where players can generate in-game currency. This includes completing quests, achieving daily rewards, in-app purchases, and milestones.
Sinks are consumption mechanisms that allow players a meaningful way to spend the resources they generated. This can include item purchases, paying in-game fees, crafting, and building.
A balanced economy, where sources and sinks are constantly in check, helps create meaningful and motivating experiences for gamers.
What are the challenges of gaming analytics?
While there are heaps of exciting innovations to come out of gaming analytics, the industry is still very young. And with that comes growing pains. Here are a few challenges to be aware of:
Resource pressures
Gaming analytics is undoubtedly complex, and requires specific expertise to execute from start to finish. You’ll need to hire the right people to set up and implement the right technology to go along with it. That includes gaming data scientists who can decipher the data to create actionable insights to work with. For smaller game developers on tight budgets, the level of resource needed can be a barrier to entry.
Technology integration
To add on to the previous point, gaming analytics systems need to work alongside existing gaming infrastructure including databases, servers, and architecture. To ensure smooth data flow in a reliable and secure environment can be expensive and time consuming.

Difficulty of cross-platform campaign measurement and attribution
Gaming marketers have dominated mobile games, but transferring the digital expertise to console and PC gaming hasn’t been easy. Mobile marketers are the kings of data, but the same level of measurement has been near impossible across platforms due to data fragmentation. That is, unless you work with a trusted MMP.
The impact of AI in gaming analytics
AI is already impacting the gaming industry in ways we never imagined. AI-powered conversations with non-player characters have taken gaming to a new level of immersion. We’ve also seen AI-assisted accessibility tools helping visually impaired players. This is only scratching the surface.
And the impact of AI in gaming analytics is no different. Here are a few ways it’s happening today.
Sentiment analysis
In the past, moderators would read forum posts and respond to emails giving feedback on your game. With AI, you can now dig through chat logs, reviews, and social platforms to get a better understanding of how gamers are feeling about your game.
Whether it’s complaints about a certain level, or overflowing support for a new game mode, sentiment analysis gives developers the data and tools to understand what’s working and what’s not – helping them improve the weakest part of their games while doubling down on the successful aspects.
Monetization
AI can take immense datasets and identify patterns of behavior that lead to a purchase, in a way that may not be obvious to the human eye. With these insights, developers can fine-tune their in-game monetization over time, improving the game with new, personalized experiences or dynamic pricing.
Game design
In-game metrics like start, fail, and complete, or sources and sinks (as described in the previous section), shed light on critical parts of the game that make both positive and negative impacts on the player experience. These insights help developers create better games without having to speak directly with players.

Fraud detection
Hackers and cheaters who gain an unfair advantage in multiplayer games are one of the fastest ways to destroy the immersion and trust in a game. Many popular games like Valorant and PUBG use AI-powered cheat detection to identify suspicious patterns of behavior that are unnatural to human movement. Quickly dealing with cheaters is one of the best ways to improve retention and minimize churn.
Dynamic in-game advertising
AI-powered advertising within games is helping improve the user experience while providing more efficient ways for advertisers to reach their target audience. Programmatic advertising allows advertisers to bid for ad space in real time, yielding higher returns for both ad platforms and advertisers alike.
Key takeaways
- Gaming analytics is the data and insights that help improve decision making in game design, monetization, game experience, and business growth.
- Gaming analytics is key to your game’s long-term profitability: as well as optimizing ad campaigns, you can use it to improve the player experience, leading to better engagement and retention over time.
- To get started with gaming analytics, you’ll need to identify the right tools including a data warehouse, a data pipeline, and a measurement partner.
- When implementing gaming analytics, you’ll need to decide which KPIs to measure to help you achieve your goals: they can be grouped under monetization, engagement, and in-game behavior.
- Gaming analytics can be more resource intensive than anticipated, requiring specific skillsets and tools to execute effectively. Campaign measurement and attribution across platforms is also challenging, unless you work with an MMP.
- AI is improving gaming analytics through sentiment analysis, monetization, game design, fraud detection, and in-game advertising.


