What is incrementality testing?
Incrementality testing is a way of measuring the true impact of advertising by comparing a test group exposed to ads with a control group that isn’t exposed.
Try searching for

How do you know, for real, that the money you’re spending on marketing is money well spent? How do you know if your ads are actually impacting consumer behavior?
The truth is, there’s only one type of measurement that can answer this question with absolute clarity.
It’s called incrementality testing.
Incrementality testing measures the true, and often hidden, return on investment (ROI) of your advertising spend.
Why hidden?
Well, the lines that separate organic traffic and paid conversions are often blurry: you could be paying to acquire new users who would have converted anyway. Incrementality testing measures the precise impact of particular channels or campaigns, so you know the true value of your marketing and can make smarter decisions.
In this article, we’ll show you how to calculate incrementality and interpret its results. Spoiler alert: there’s more to it than simply suspending your paid media activity for a week and analyzing the effect.
We’ll cut through the jargon and give you practical tips that you can use to get your own tests up and running, so you’ll know for sure if your ad spend is working for you — and how you can optimize your budget.
Incrementality tests take a scientific approach, splitting the target audience into two distinct groups:
By measuring the results from each group, you’ll see which conversions would not have happened without advertising. The difference between the groups — expressed as a percentage — is known as incremental lift.
For example, Marco’s Pizzeria launches a new, thick-crust pizza and wants to determine how successful its advertising campaign is. After a month of handing out coupons to passers-by, they measure how many of the new pizzas were purchased using the discount coupon and how many were purchased without it.
The difference in sales between the two groups of customers is the incremental lift.
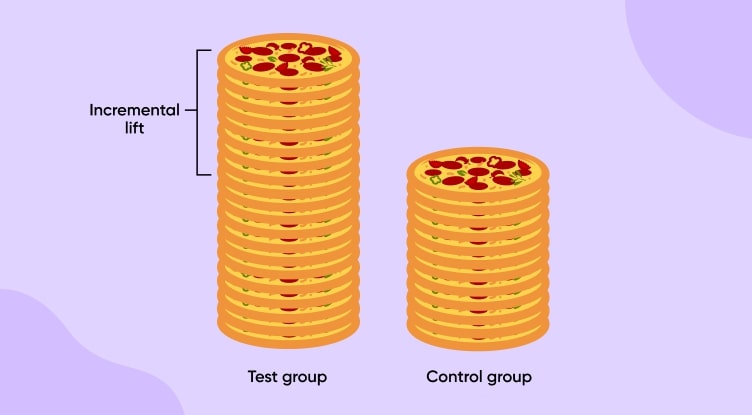
Incrementality experiments compare the results of the test group with those of the control group. There are three possible outcomes:
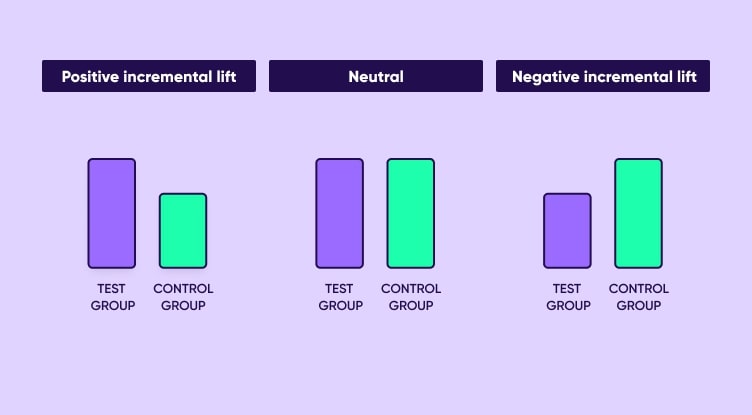
In the first example we can see that the experiment led to a positive incremental lift: the test group results are higher than the control group. That means the paid campaign you’re measuring was effective, as it generated an increase in revenue.
In the second example, the test and control groups delivered the same (neutral) results: while the campaign is generating sales, there is no incremental lift from your ads. In this case, you should consider pausing the campaign or trying a different approach (for example, changing the creative or updating targeting).
The final example shows a negative incremental lift: in other words, the campaign is doing more harm than good. Although this is rare, it can happen if over-exposure in a remarketing campaign leads to negative brand impact, for example.
It’s also worth looking into the test itself, to check that it’s configured correctly.
Before we jump in, let’s make sure we’re all on the same page with the key terms and metrics.
| Term | Definition |
|---|---|
| Key performance indicator (KPI) | A measurable value that demonstrates how effectively a company or app is achieving its business objectives |
| Control group | A segment of users who will not be exposed to the ads served to the test group in a given campaign audience |
| Test group | A segment of users who will view the ads in a given campaign |
| Statistical significance | A measure of the likelihood that the difference in results between the control and test group is not a coincidence |
| Incremental lift | The percentage difference of the test group from the control group |
Now you’re familiar with the terminology, let’s move on to the process.
Remember doing science experiments in school? You’d typically work through a series of stages: your hypothesis, method, collection and analysis of results, and your conclusion.
Incrementality testing is similar, and has five distinct stages: define, segment, launch, analyze, and take action. Let’s dive a little deeper.
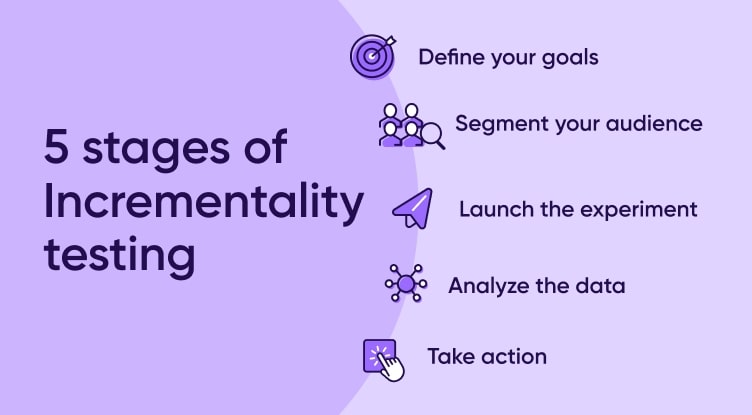
When starting an incrementality experiment, think about what you want to prove: you need to define your hypothesis and identify any vital business KPIs that you want to examine (for example, installs, ROI, ROAS, or something else).
When running an incrementality test on a remarketing campaign, select the audience you want to run this experiment with and make sure that you properly segment a section of this audience as a control group.
Pro tip: Your attribution platform will most likely be able to help you segment your audience as you wish and build your campaigns accordingly.
The groups – control and test – should have similar characteristics but not overlap.
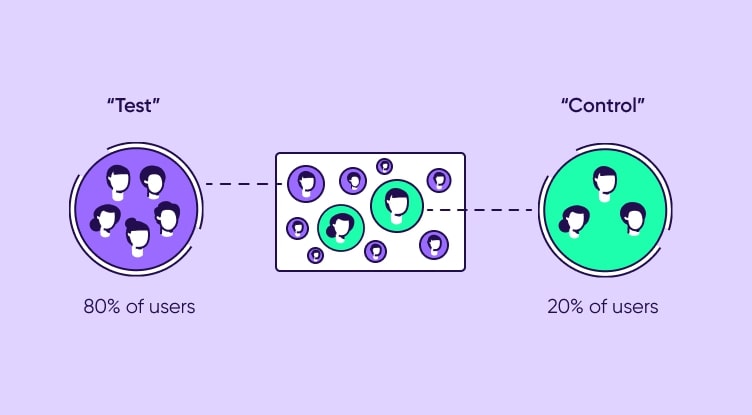
This can be tricky when focusing on UA (user acquisition) campaigns, as we don’t have a unique identifier to differentiate the audience. However, there are other identifying factors you can use to segment your audience, such as geography, time, products, or demographics.
Decide on the duration of your test (this should be at least a week) and the testing window, and launch it.
Your testing window is the days of user action leading up to the test. This period you choose will depend on your app’s business cycle and the volumes of data you have to work with.
Make sure to run the test when your marketing calendar is clear, to prevent other campaign activity from muddying the waters.
Once you’ve collected all the data from your control and test groups, aggregate and compare it to identify the incremental lift in the specific KPI(s) you selected earlier.
This will show you whether the incremental lift was positive or negative, or if the effect was neutral. If you notice a wide gap between your control and test groups, it could indicate something wrong in the configuration of the experiment and you might choose to retest.
While incrementality testing can be challenging to set up on your own, attribution providers like AppsFlyer offer integrated incrementality testing tools. These allow you to pull all your test data directly from your attribution platform into an incrementality dashboard, making the process more streamlined and efficient.
Now it’s time to apply the insights you’ve gained to your campaigns to maximize impact. This could be the best messaging for each target audience, the optimal time for re-engagement, or the most effective media source, to name a few.
Once you’ve accumulated and aggregated the data, how do you then go about calculating the incremental impact?
There are two main methods:
Measuring incremental profit enables you to pinpoint the real value of a given media channel. It can be calculated as follows:
Channel profit – control group profit = incremental profit
For example, let’s say you spent $2,000 on a campaign. Media channel A generated $5,000 in profit, and media channel B generated $3,000. On the surface, these both look like profitable channels. However, your organic campaign also generated $3,000 — the same as channel B — so the incremental profit on that channel was actually zero.
| Channel | Spend | Profit | Incremental profit |
|---|---|---|---|
| Media Channel A | $2,000 | $5,000 | $2,000 |
| Media Channel B | $2,000 | $3,000 | $0 |
| Organic | $0 | $3,000 | N/A |
If your channel profits are less than or equal to your control group profit, you’re not making any incremental profit. Basically, you’d be making the same profits without advertising — so save your budget and invest in a channel, activity, media source, or campaign that can deliver more impact.
Incremental lift focuses on the number of conversions you achieve for each group. Use the following formula to calculate it:
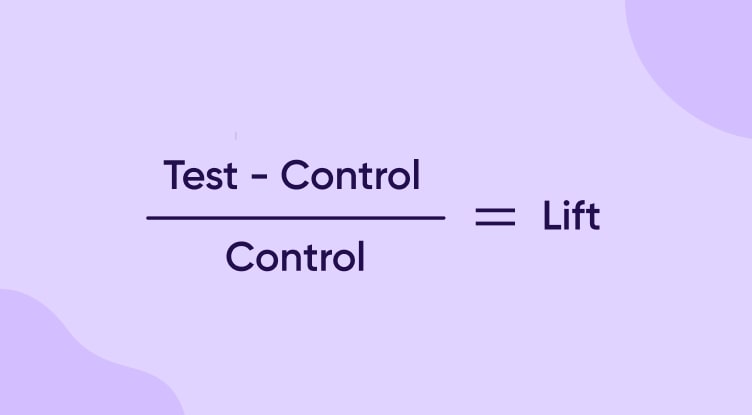
For example, let’s say that your test group generated 10,000 conversions and the control group resulted in 8,000 conversions:
(10,000 – 8,000) / 8,000 = 0.25
Whether that 25% incremental lift is judged as good or bad will depend on your KPIs and ROAS.
One way to test this is to measure it against cost. Divide the cost of acquisition (CPA) by the incremental lift, and compare it against your lifetime value (LTV).
For example, if your CPA is $2, divide that by 0.25, which equals $8. If your LTV is higher than $8, you’re doing well. If it’s lower, you may need to reassess your campaign strategy.

Now that you’ve got the gist of incrementality testing, you might be wondering, is it actually that different from A/B testing?
In fact, incrementality is essentially a type of A/B test. Standard A/B testing divides your product or campaign into two, A and B, and then divides your audience into Audience 1 and Audience 2. Each audience sees a different version of the product or campaign, so you can understand which delivers the better results.
For example, one audience sees a banner with a blue button, and the other sees the same banner but with a red button. Comparing the banner’s click-through-rate (CTR) for each audience is a standard A/B test in marketing.
Where A/B testing differs from incrementality is the control group, where one portion of the audience is not served any ads at all during this time.
So, whereas A/B testing lets you compare versions of an ad, incrementality looks at whether running a given ad is better than not running it at all.
How do you avoid serving ads to an audience, yet still “own” the ad real estate?
There are three methodologies:
This method calculates the experiment results based on the initial treatment assignment, and not on the treatment that was eventually received. This means you mark each user for test or control in advance, rather than relying on attribution data. You have the “intent” to treat them with ads or prevent them from seeing ads, but there’s no guarantee it will happen.
This is another example of a randomly split audience, but this time it’s done just before the ad is served. The ad is then withheld from the control group, simulating the process of showing the ad to the user (known as ad serving), without paying for placebo ads. This tactic is mostly used by advertising networks running their own incrementality tests.
These are in place to show ads to both the test and control group. However, the control group is shown a general PSA while the test group is shown the variant. The behaviors of users in both groups are then compared to calculate incremental lift.
Let’s get one thing clear: incrementality is not the same as attribution.
Attribution aims to show which particular channel (or “touchpoint”, in marketing-speak) led to a conversion: did the user make a purchase after seeing your banner ad, your Facebook post, or your organic search result?
Of course, it’s not always that simple, which is why multi-touch attribution was developed: it enables you to split the credit between the various links a user was exposed to.
But incrementality goes further, asking: what would have happened without that channel? Would you have got the conversions anyway? If that’s the case, you’re wasting your budget.
Your ROAS (return on ad spend) is a crucial metric that shows what you earned from your marketing campaign versus the budget you put in — in other words, how profitable the campaign was. And it’s not just about installs — you also need to consider lifetime value (LTV), and remember to factor in your media costs.
Where does incrementality fit into this? Well, the two metrics can work together, with incrementality testing giving you a deeper insight into your ROAS. Specifically, it tells you if you could have an even better ROAS if you spent less on advertising, and if you’d achieve the same or better results from organic users.
The incremental impact on ROAS (aka iROAS) is calculated using the following formula:
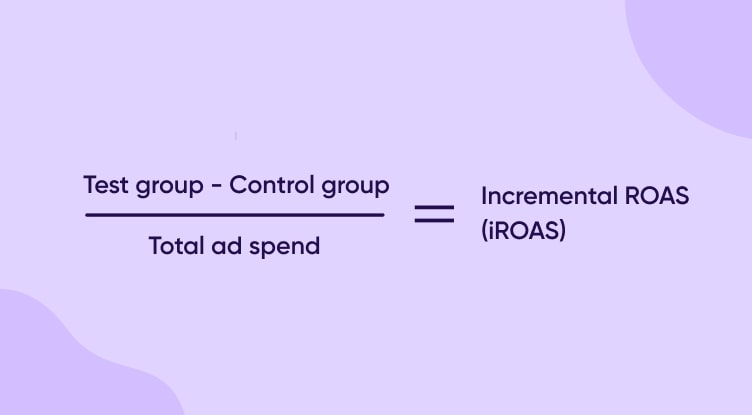
Notice this doesn’t include organic conversions: by removing them from the equation, you can calculate the true impact of your campaign and optimize accordingly.
For example, if your iROAS is less than 100% you can redistribute budgets to better-performing campaigns and channels. If it’s equal to or higher than 100%, you know none of that comes from organic traffic and that your ads are effective.
Adding incrementality gives you the extra layer of detail you need to move from simply measuring ROAS to understanding the true impact of your campaigns and ad spend.
Incrementality testing offers big benefits for your campaigns and strategic planning, helping you make evidence-based decisions. For example:
Of course, no method is without its challenges and incrementality is no different. It can be complex, so look out for the following:

By now, you’ve got the message that incrementality testing is hugely important, but potentially complex. If you’re ready to take the plunge, here are a few best practices to help you get the most out of incrementality.
Are you measuring overall campaign impact, or are you interested in a particular audience segment? Do you want to compare channel effectiveness, or understand how much you should spend on one channel? There are lots of ways to approach incrementality testing, so be specific.
We all know it’s cheaper and easier to re-engage existing users than attract new ones. But what’s the best way to approach it? When it comes to remarketing campaigns, incrementality testing can be a game-changer in terms of identifying the best channels and times to reconnect with users.
External factors change all the time, so marketers can’t afford to stand still. Your preferred channel might gain or lose users, new competitors or technologies could emerge, or economic conditions might impact customer spend. Continually testing will make sure you keep your finger on the pulse.
As we’ve covered, incrementality testing can be time consuming and technically challenging. Consider whether a mobile measurement partner could make your life easier: as well as discussing cost, be sure to ask questions like what segmentation they offer, what channels they can measure, and when and how they’ll present your results.
Incrementality is a powerful tool that can give you real insight and confidence in your channel selection, budget allocation, and ROAS measurement, while ensuring your marketing efforts reach their full potential.
Here are the key points to remember:
Apple’s upcoming enforcement of the ATT framework, as part of iOS 14’s privacy-driven approach, will largely eliminate the ability to measure via device matching.
But since Apple’s SKAdNetwork only captures about 68% of installs driven by non-organic activity, other measurement methods will become increasingly important in order to fill the gap and allow you to make smart, data driven decisions, methods including probabilistic attribution, web-to-app, and, you guessed it — incrementality!
Incrementality testing is a way of measuring the true impact of advertising by comparing a test group exposed to ads with a control group that isn’t exposed.
Incremental lift is determined by the percentage difference in conversions between the test and control groups. Positive incremental lift shows your ads are having the desired impact — the higher the percentage, the more effectively they convert.
While A/B testing compares different ad versions, incrementality compares running ads versus not running them at all, measuring whether the ads themselves drive conversions.
Incrementality testing reveals if your ads contribute to incremental revenue beyond what organic conversions would achieve. This helps you better allocate budgets to maximize the return on your ad spend.
Incrementality testing is complex, requiring expertise in development and analysis. Further challenges include removing external factors (noise), setting appropriate test parameters, and ensuring the right timing to avoid skewed results.