New data shows uninstalls remain a significant pain for apps

As competitive as the app marketing space is, it is no wonder that apps are extremely challenged with retaining their users. With too many competitors to count, and increasingly high user expectations, an app that does not deliver on all fronts, and fast, simply won’t be used. Even worse, it will be uninstalled.
Removing an app from a device is quite an aggressive move, clearly indicating that something is wrong. Understanding why, when and which users uninstall apps is extremely important in the fight against churn. In a freemium dominated space, securing ongoing usage is absolutely vital to success. Without it monetization becomes all but impossible.
Furthermore, uninstall measurement allows app developers to apply privacy measures in order to protect their customers’ privacy and data. This data can be used to exclude users who uninstalled their app (and are clearly not interested in their service) from their targeting.
More and more apps are recognizing this reality. In fact, since releasing our uninstall attribution feature in July 2016, we’ve seen a constant increase in the share of apps measuring this metric.
To help you understand how many users uninstall apps and compare your app to the competition, here are some updated benchmarks based on the following data sample:
- 110 million installs
- 1,000+ apps
- Duration: April 2018
We isolated a cohort of users who downloaded apps (that have uninstall attribution set up) during the first ten days in April.
We then counted how many of these users uninstalled the apps within 30 days to calculate the uninstall rate.
Findings
What is the global uninstall rate?
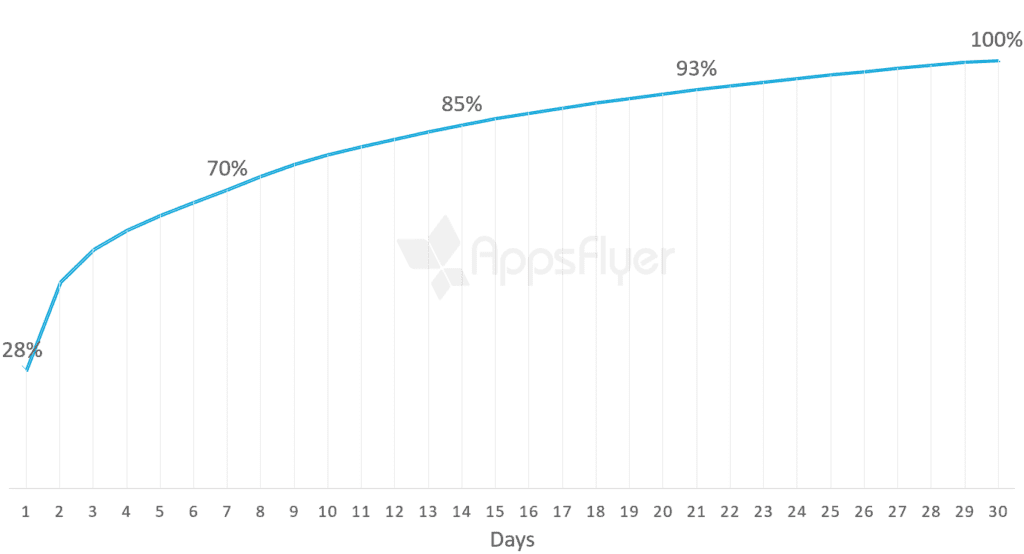
The overall app uninstall rate after 30 days is 28%. That means that almost 3 out of 10 apps installed end up being uninstalled within 30 days of a download! Clearly, uninstalls are a major problem as users don’t think twice about deleting apps from their device.
What does the rate look like in different markets?

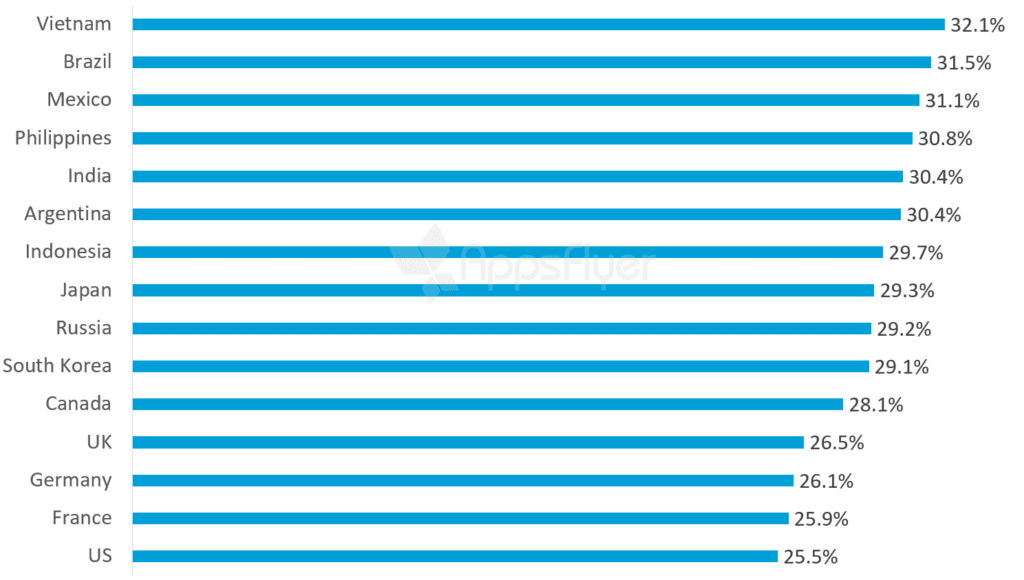
The data shows that, overall, developing countries have the highest uninstall rate while developed countries have the lowest. About 30% separates the first (Vietnam) and the last (the US). This is probably due to the fact that the average size of storage on a device in developing countries is smaller.
More users in these regions have no other choice but to uninstall apps at a greater frequency in order to free up space.
How does the uninstall rate differ by category?

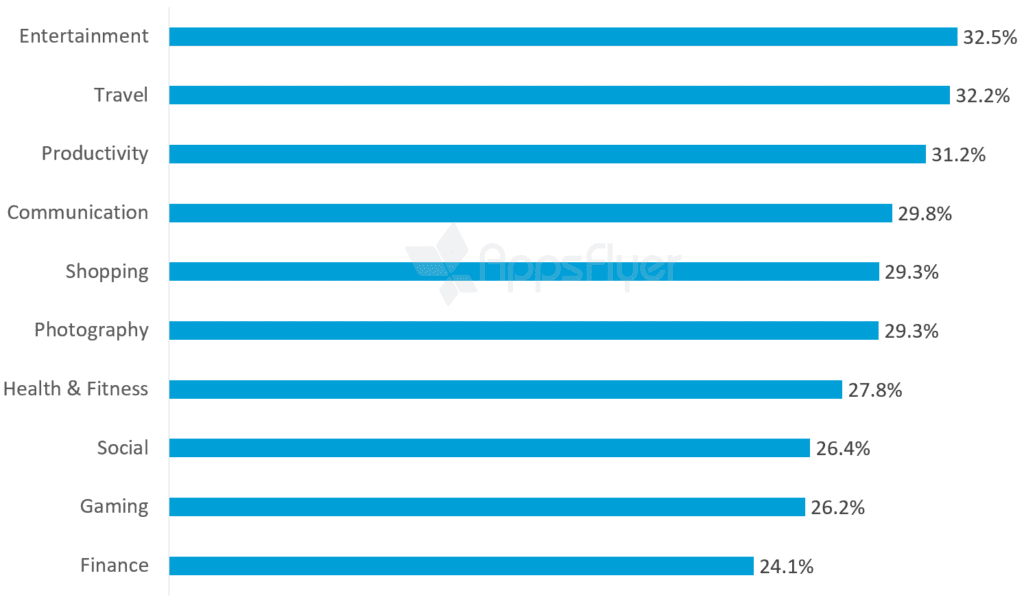
It appears that Entertainment apps fall short when it comes to meeting user expectations. In this category, where streaming of video content is common, powerful infrastructure is required to ensure smooth sailing. When it doesn’t, and this still happens often, users get frustrated.
Also, many entertainment apps need to regularly update content to keep users coming back for more. This requires significant resources and could also lead to abandonment when content is insufficient.
Travel apps have the second “best” uninstall rate. Because travel is seasonal and bookings rather rare, users often install an app, book their flight or hotel, and then uninstall the app at least until the next time they need to travel.
How long after downloading an app do users uninstall it?

The data shows that, as expected, the uninstall rate curve flattens over time. Clearly, the main problem is on day 1 and then also during week 1.
Taking action
Measure it!
Clearly, uninstall is a significant problem and apps must measure their uninstall rate, understand exactly when, why and from which sources uninstallers came from to minimize it. Setting up uninstall attribution is quick so it is definitely worthwhile.
For more information on using your data to optimize retention (and reduce uninstalls!), watch the MAMA Board below:
Remember first impression is everything
Because the uninstall rate is the highest on the first day, it is absolutely critical to nail the onboarding process. Make it seamless and engaging else you risk losing your acquired users at the blink of an eye. To reduce the uninstall rate between day 1 and 7, make sure your first interactions are designed to generate a strong, lasting connection with the user.
Deliver on what you promise
Overpromising in an attempt to get a download can backfire, leading to frustration and potentially damage your brand’s image in the eyes of the user beyond repair.
Inform your users about your app before download
Use video ads, playable ads if relevant, and a highly descriptive app store page which includes video/s and images users.
Keep your app top-of-mind
To prevent uninstalls, try to encourage ongoing engagement from the get go. Use all available channels – push, email, retargeting, social – to continuously keep the app top of mind. Make sure the user experience is optimal: do not overexpose your users, time re-engagement carefully, and make sure you have deep linking in place to deliver a seamless journey.
Define in-app KPI milestones to understand where users drop off
Understand the relationship between usage and in-app funnel progression (e.g. in Gaming: tutorial completion, registration, level 5 success, level 10 success, in-app purchase. In eCommerce: category, product, add-to-cart, purchase).
It is particularly important to know at which point an active user suddenly becomes inactive so you can encourage them to continue using your app by offering a special promotion, a discount, etc. And on an aggregated level, if you’re seeing a significant drop after a certain stage in your funnel, you probably need to change something in the app itself.
Listen to your users
Be part of any conversation about your app on social networks, app stores (through ratings and reviews), and communities. Make sure you tackle any negative feedback – both personally to the user in question and within the app itself – to learn from your mistakes and correct them.
Have a fantastic app!
Although this is mainly aimed for product managers rather than marketers, the best way to reduce an app’s uninstall rate… is to have a truly great app. This may seem obvious but if your app does not deliver on all fronts then all the marketing data in the world won’t help.


