Initial data indicates ATT opt-in rates are much higher than anticipated — at least 41%

Note: For regularly-updated ATT opt-in rate benchmarks, visit AppsFlyer’s iOS 14 & ATT insights dashboard
When Apple first announced that it would enforce an opt-in mechanism as part of its AppTrackingTransparency (ATT) framework in iOS 14, the mobile app industry entered into a period of uncertainty.
In this new reality, users would have to actively agree to allow an app to use their Apple IDFA identifier for various purposes — attribution, ad targeting etc.

Initially, there was concern that mobile apps would no longer be able to properly measure and optimize their iOS campaigns. Over time, this sentiment shifted as the industry embraced innovation to adapt to the age of privacy and ensure measurability is largely retained.
But one belief remained: The IDFA would become all but obsolete. Multiple estimates of the opt-in rate have surfaced: as low as 2% and as high as 20%, with most closer to the lower end. Single digits was the common language.
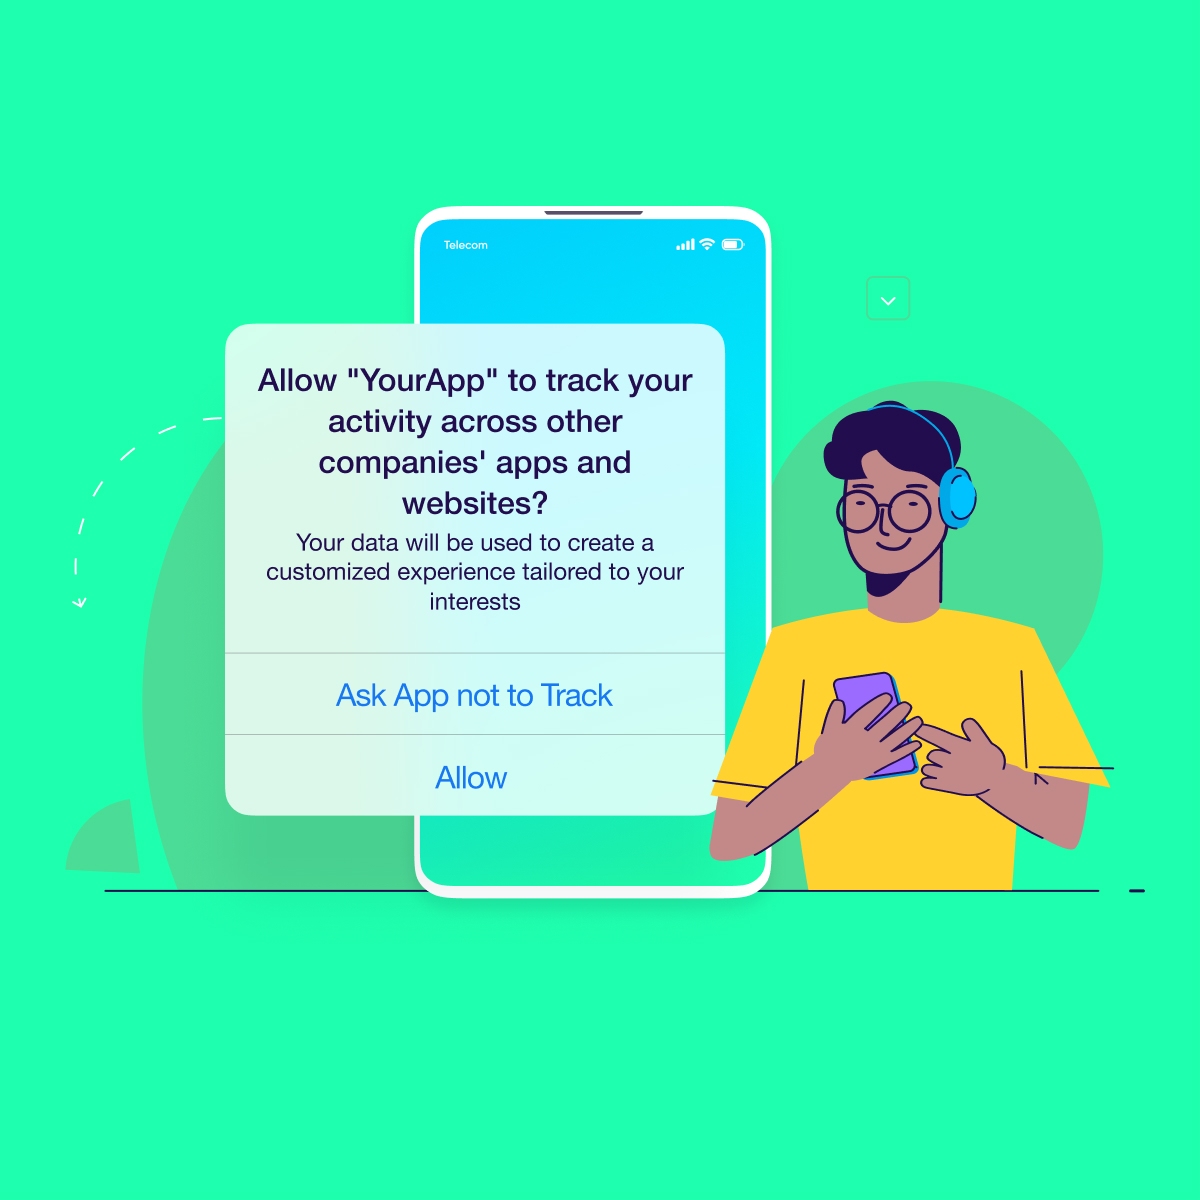
The assumption was that with privacy taking center stage in public perception, very few users would opt-in to ‘tracking’, especially in light of the language used by Apple in the prompt message. It was certainly a logical assumption.
But what does the ATT consent rate look like in the real world?
That is the million, or rather billion dollar question everyone is eager to answer. And we have some answers for you based on research of millions of interactions in hundreds of apps.
Don’t count out the IDFA just yet
Fast forward to April 2021, with Apple’s enforcement of ATT most likely around the corner, opt-in numbers have turned out to be quite different. It seems that in reality, opt-in rates are much higher than previously anticipated: 39% overall (weighted average, where totals are used), and 26% average per app (where each app has equal weight regardless of its size, excluding outliers).
That’s good news for both marketers who want to make the most of their campaigns with more available, consented data, and end-users who prefer a more personalized experience and have given their clear consent for it.
It is important to stress that these are preliminary insights from nearly 550 apps, and that these apps are early adopters that may not represent the industry at large. Numbers may change after ATT is enforced.
But we do have confidence that there is a large enough sample at present to be cautiously optimistic. Overall, in the last three weeks we counted 7,681,724 times users saw a prompt message and allowed ‘tracking’, and 12,120,114 cases when permission was denied (not necessarily via the prompt — more on this distinction ahead).
Here is the breakdown by category:
What is most striking in this data, beyond the high overall rates of course, is the gap between non-gaming and gaming apps (42% vs. 31%). It appears that lower brand affinity in gaming leads to much lower opt-in rates. Although brand equity is on the rise in gaming, it is mostly relevant only for the largest studios.
In the gaming space, end-users adopt an experimental mindset. They simply try out new games without paying much attention to the brand behind them. Their initial connection to a game is almost non-existent, and any message that asks for tracking permissions is treated with caution.
Many non-gaming apps, on the other hand, have a stronger brand affinity and are known to end users. With higher levels of trust, opt-in rates rise. The intent is also stronger with these apps: for example, when looking to buy a new laptop, to order food, or to subscribe to a yoga course.
What about LAT users?
It should be noted that the opt-in rate we presented is not exactly the percentage of users with an IDFA, but rather the de-facto IDFA rate. This is because there is also a ‘Restricted’ status (end-users who are underage and cannot opt-in, or restricted devices) that was excluded.
Currently, this group, which cannot have an IDFA even if they wanted to, is about 13% and it will be interesting to see if this number will increase or decrease in the future.
Furthermore, if it wasn’t for Limit Ad Tracking (LAT), numbers could be even higher. We calculated the opt-in rate as Authorized / (Authorized + Denied). But ‘Denied’ also includes users who enabled LAT in previous iOS versions. These users are not presented with the ATT prompt when they update their OS, and are automatically transferred to ‘Denied’ or ‘Restricted’ status.
ATT data, however, does not distinguish between these two groups.
What this means is that the 39% figure actually represents the minimum, and can only increase (within the prism of this initial data sample, not post-enforcement which holds more unknowns). How so? If you remove LAT from the equation, the denominator would decrease and so would the overall figure, as the following example illustrates:

Average per app
Another view of the data shows that the average per app is lower than the weighted average, but still higher than expected at 26% opt-in rate.
The fact that the weighted average is higher than the average per app means larger apps have higher opt-in rates. Indeed, the top 10% (by device count) have a 40% higher rate than the bottom 10%, while the top 50% have a 20% higher rate than the low 50%.
Distribution: Half of apps have opt-in rates above 29%
The following shows the opt-in rate distribution of all apps in our sample:
The median opt-in rate in this chart is 29%, which means half of the apps had an opt-in rate that exceeded 29%. That is not a small number and it demonstrates that many users are willing to opt-in to measurement for the sake of an improved user experience, and apps can convince users to do so.
How to optimize opt-in rates
As early adopters, it is evident that the apps in our data sample are doing everything they can to increase their opt-in rates.
Here’s what can be done:
1. Timing
Finding the precise moment in the user journey to prompt the user with the ATT dialogue is a key factor to consider.
For example, if you are able to increase trust, or better present the value of your product, the chances of opting-in increase compared to showing the prompt upon first app launch.

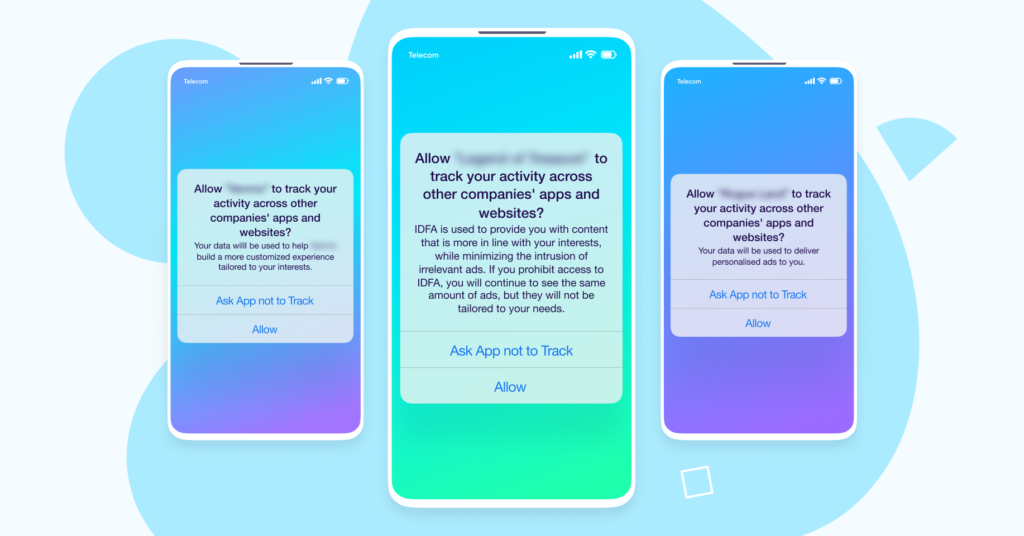
2. Customized purpose string
The unbolded text can be edited so you can better explain why you want to capture the user’s IDFA.
Here are a few real world examples we’ve seen apps use:

3. Pre-ATT prompt
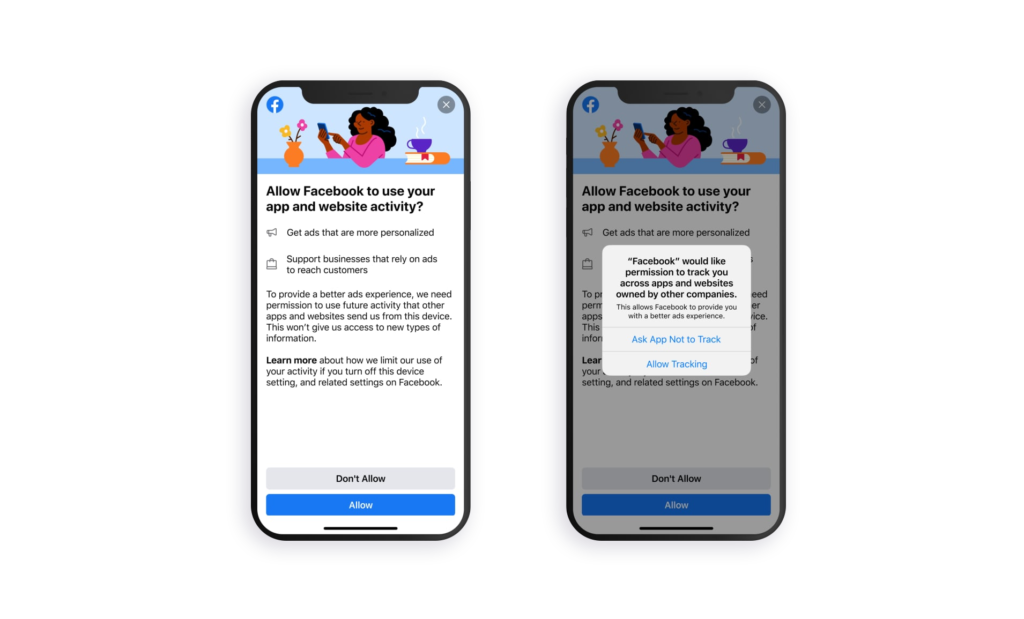
We highly recommend marketers use a “pre-ATT prompt”, basically gating the Apple ATT dialogue behind your own native prompt.
That native prompt is entirely yours, so you can customize the design, timing, and messaging to best fit your app – and ultimately show users the value of opting-in:
- Help your app stay free
- Show users content that is relevant to them
- Prohibit use of their data for any purpose other than providing them with relevant experiences
For example, here’s Facebook’s native prompt they are currently testing out on iOS 14 user

Whatever you use, make sure not to incentivize users to opt-in with discounts or other offers as this is against Apple’s terms.
4. Brand affinity
Last but not least, as explained above under the first chart, brand power plays a key role. The more a brand is known to a user, the higher the level of trust, and ultimately the higher the chances of opting-in. Branding-driven efforts and campaigns can therefore improve opt-in rates.
What’s next?
There are a few scenarios that could unfold:
- Similar to GDPR and CCPA, at first users would read through the message and decide how they want to go about it; once they later realize that these messages are repeated, most would simply approve without a second thought. This could happen if people will notice that the same message appears in every app they download.
- End-users would get tired of this prompt and will eliminate it across all apps in the device settings
- A large percentage of apps maintain default settings and do not optimize their opt-in rates, leading to lower acceptance of tracking.
The bottom line
No matter which scenario unfolds, higher opt-in rates can help app owners in many ways: more granular attribution, remarketing towards consented users, ad monetization, maintaining communication with end users thanks to a far more relevant/contextual experience, and much more.
Therefore, there is no doubt that the market will further evolve by developing more strategies and improved experiences to further optimize the opt-in funnel.
Our research proves that there is indeed plenty to work with. Doing the right things as noted above can significantly increase the number of consented users, which can be highly beneficial for iOS apps.
We will keep a close eye on the numbers as they continue to roll in before ATT, and of course after. In the meantime, make sure you optimize the user experience to improve opt-in rates. Stay tuned!


