

2025 App Marketer Survey
")

The last 12 months saw an industry on the move. Generative AI tools have become an everyday part of the mobile advertising industry, transforming how we think about the future of creative production, campaign optimization, operations, and more. Although in its early days, the new technology also introduces difficult questions about the complexities of implementation and the required organizational changes.
Macroeconomic conditions are improving across global markets, and consumer apps, particularly, have seen stellar growth. Social media and video streaming apps capture the lion’s share of user attention, but giants like Meta and TikTok may face regulatory challenges in key markets like the US. The mobile gaming industry continues to be a dominant force, but there are lingering questions about market saturation and sustainable growth.
To kick off the year with new learnings, we combine high-level data and marketer sentiment to provide a well-rounded picture of the mobile app industry at a time of uncertainty and opportunity.
New data from both Sensor Tower and AppsFlyer sheds light on the macro trends in 2024 that are driving expectations for 2025. AppsFlyer and Liftoff’s survey dives into the details with a summary of marketer sentiment on campaign performance and the benchmarks, technologies, and channels that matter. Taken together, the report provides a snapshot of the successes, challenges, and expectations that set the table for this year.
As app marketers look ahead to 2025, the overall outlook remains optimistic. A majority of marketers expect the year to be as strong or stronger than 2024, with many increasing budgets to support continued growth. While acquisition remains crucial, there continues to be a growing emphasis on sustainable revenue strategies, audience retention, and efficiency in marketing spend. Investments in advanced analytics, AI-powered creative development and optimization are playing a larger role, helping teams refine their approach and maximize long-term value.
Shani Rosenfelder, Director of Market Insights at AppsFlyer.
THE BIG PICTURE
Consumer apps are growing rapidly, shifting the balance between games and non-gaming apps. Downloads are increasing, and so is time spent.
The growth of non-gaming consumer apps has been an ongoing story across the mobile industry for the past two years.
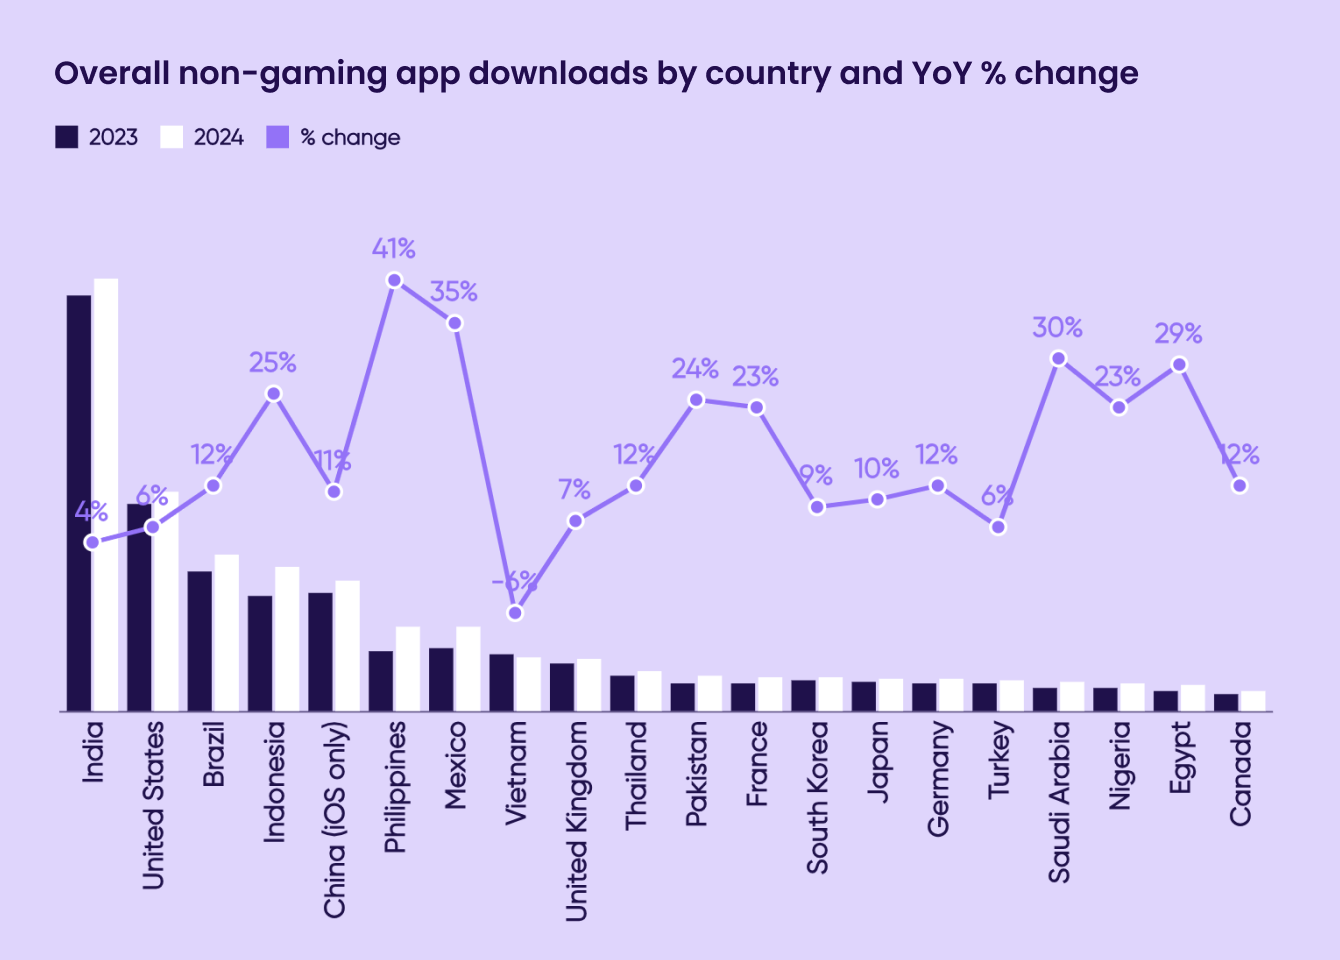
New data from AppsFlyer shows an overall 7 percent increase in downloads year-over-year (YoY) worldwide. However, non-gaming app categories saw a striking 12 percent increase.
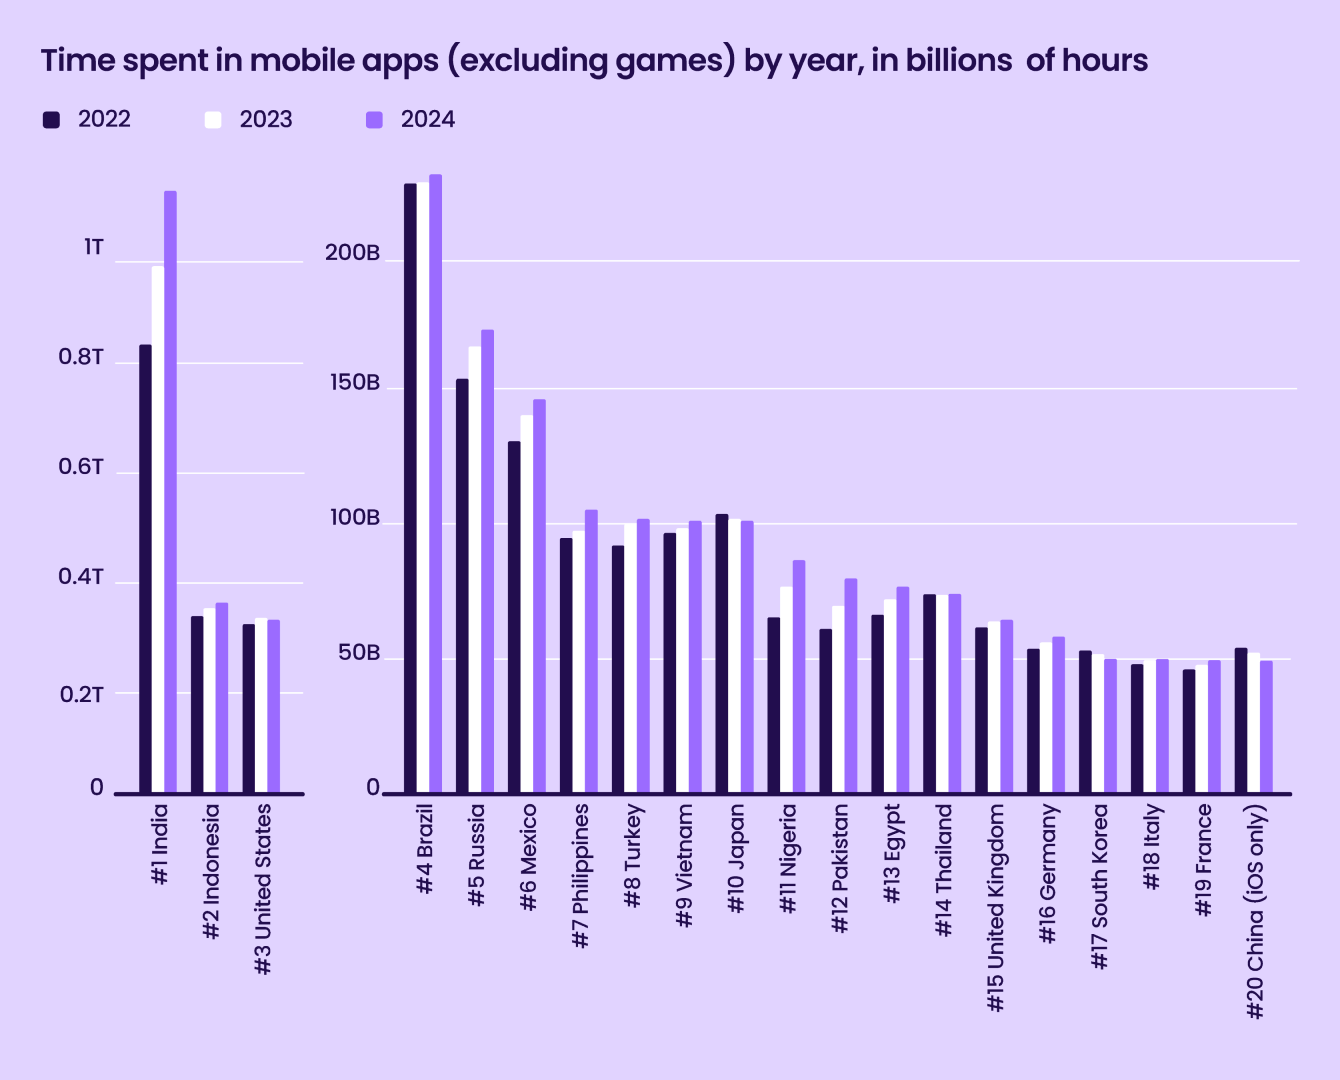
Time spent in non-gaming apps has increased or stayed steady across almost all top markets.
According to Sensor Tower data, users spent 4.2 trillion hours in apps globally in 2024 — about 500 hours on average for every person on earth.
Non-gaming apps represent a growing share as users get accustomed to making purchases and tracking their daily activities on apps. App developers are also evolving to focus more on monetizing the attention they command via in-app advertising and hybrid monetization strategies.
In-app purchase (IAP) revenue for consumer apps accelerates growth
As time spent in apps increases, developers are seeing higher revenue. Sensor Tower data measuring revenue through app stores (excluding out-of-store revenue from app categories including eCommerce, food & drink, and travel) indicates consumers are spending more on in-app purchases across nearly all markets.
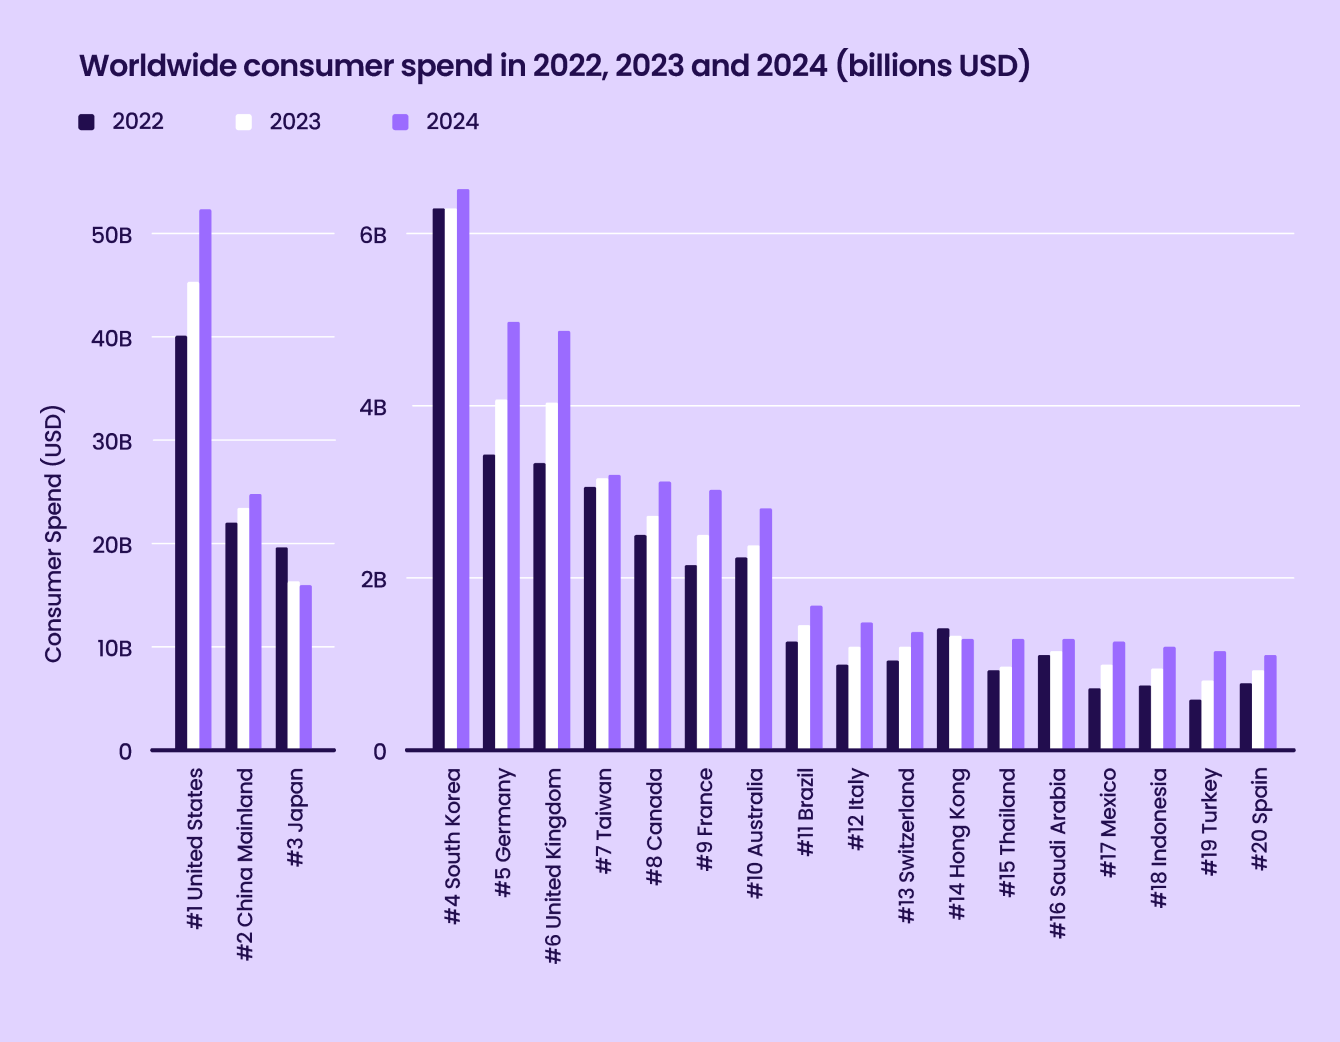
Analyzing by country, spend in top markets like the US, China (Mainland), Germany, and the UK has been growing every year since 2022, likely due to improved app experiences and growing consumer comfort with making app-based purchases.
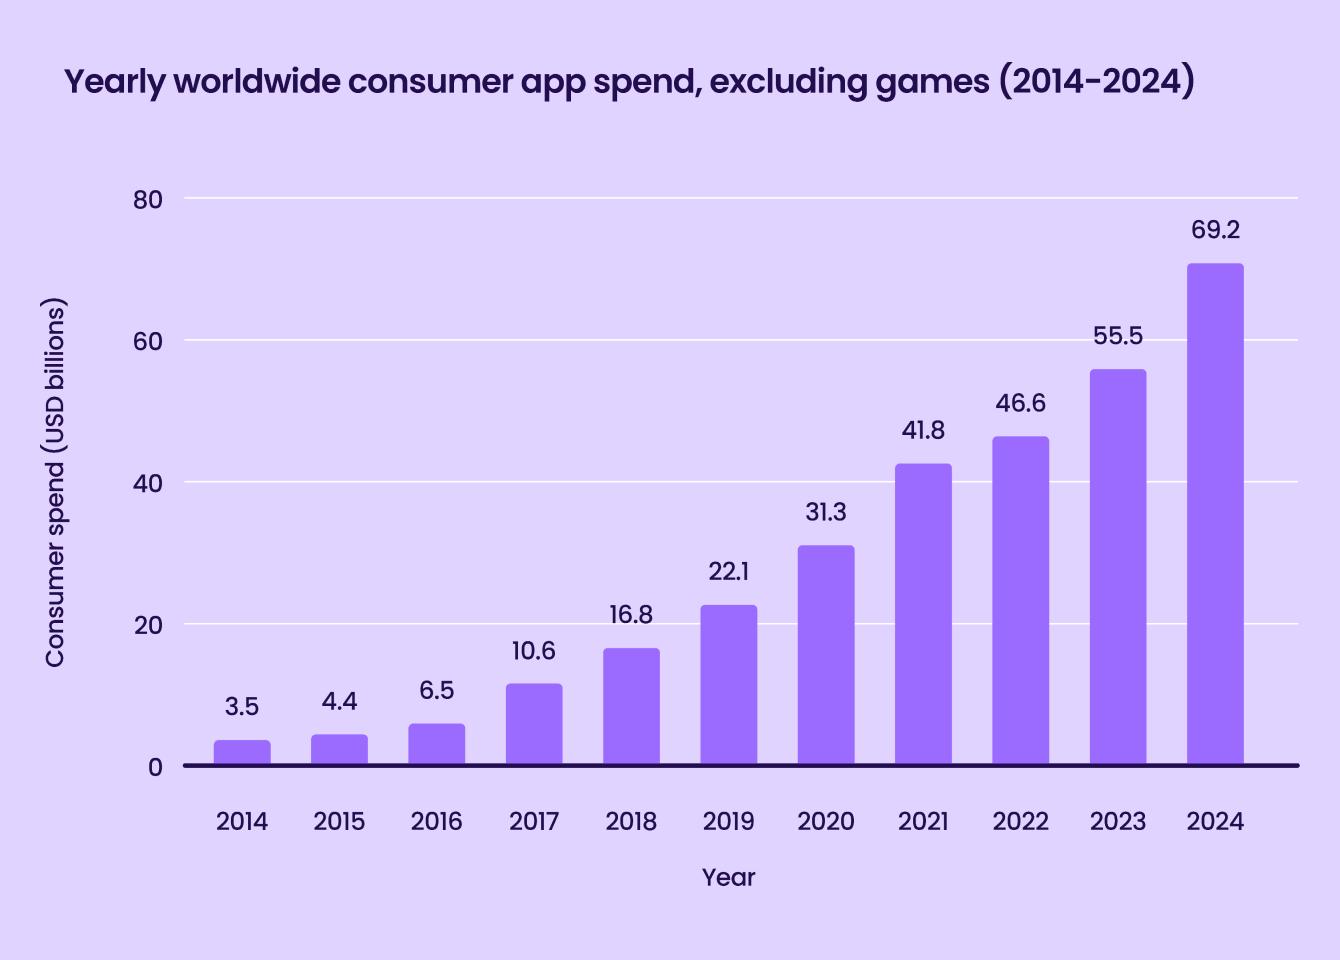
Looking at longer-term revenue trends, consumer spend on non-gaming apps has been rising steadily for the past decade, climbing from $3.5 billion in 2014 to more than $69 billion in 2024. Total spend grew $13.7 billion year-over-year from 2023 to 2024. Non-gaming apps will soon surpass mobile games in share of total consumer spend.
Our findings highlight a shift in consumer spending, with social media and streaming leading non-gaming revenue growth, while shopping and financial services apps continue to expand their user base. Europe emerges as a key growth driver, and digital fatigue in major regions signals the need for stronger retention strategies, focusing on AI-driven personalization and seamless user experiences. AI’s influence is now everywhere, powering app discovery, content recommendations, and advertising strategies.Donny Kristianto, Principal Market Insights Manager, Sensor Tower
See more perspectives from Sensor Tower in their State of Mobile 2025.
App store data indicates that consumers prioritize entertainment, photo & video, and productivity apps
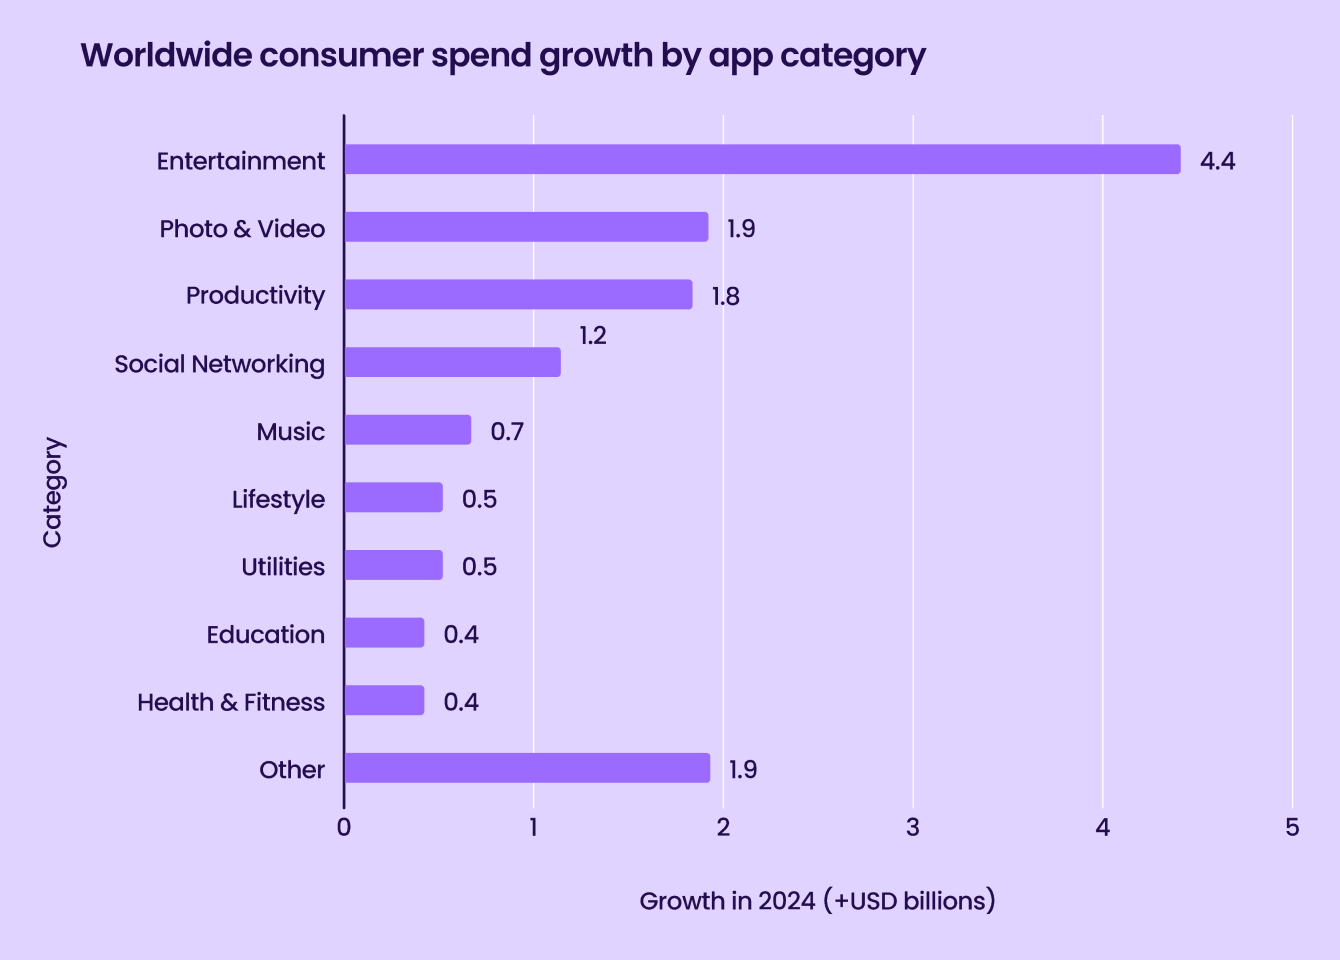
Users are spending liberally but unevenly on consumer apps. According to Sensor Tower, compared to 2023, users spent over $4.4 billion more on entertainment apps. This increase is over twice as much as in other high-growth categories like photo and video, productivity, and social networking. Categories like video streaming are more divided, with multiple apps competing for market share.
Food & drink, finance, and shopping apps are also scaling IAP revenue YoY
AppsFlyer data from external platforms (excluding the app store) shows that across the board, non-gaming app categories are growing around 20 percent YoY. The top categories include food & drink, finance, shopping, and travel.
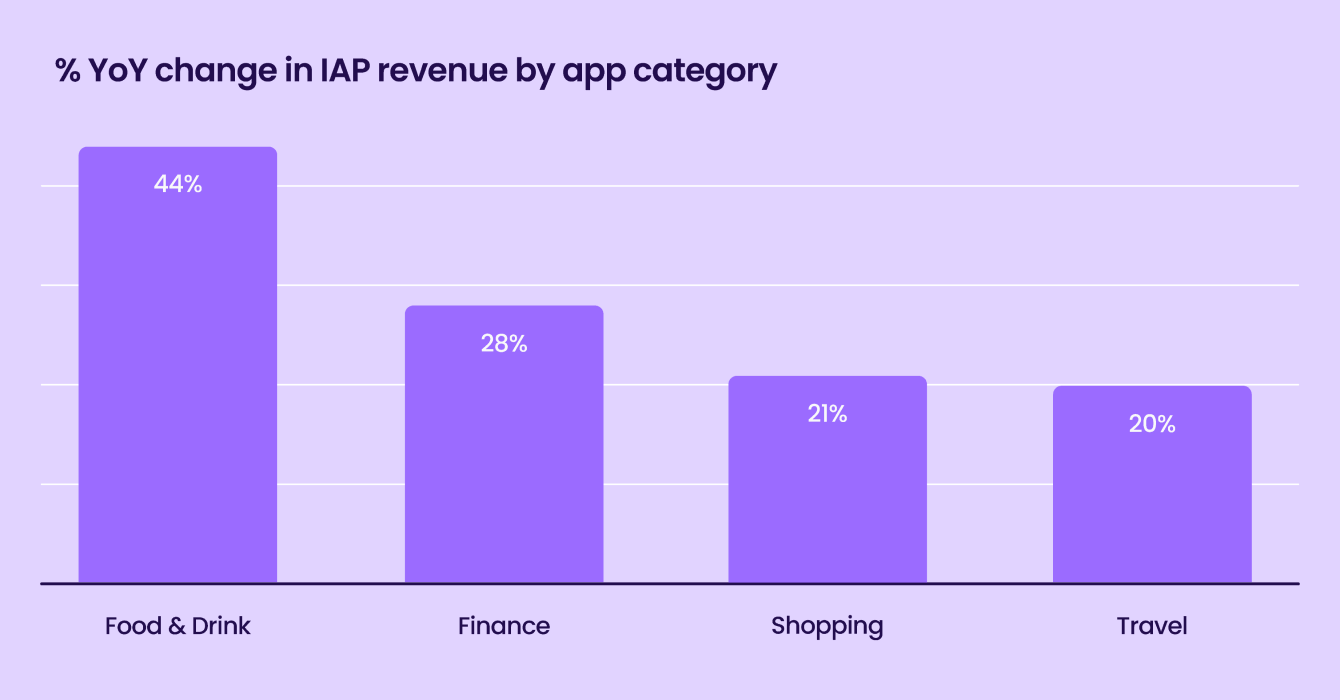
Food & drink saw an incredible 44 percent growth YoY between 2023 and 2024. Finance, shopping, and travel apps also saw IAP revenue grow over 20 percent—likely driven by improvements in fintech, e-commerce, and travel-booking platforms as well as a greater focus on monetization strategies across the board.
Mobile game revenue remains stable, and downloads see a slight dip
2020 and 2021 set unprecedented growth benchmarks for mobile games. Still, in the years since the pandemic, game developers have had to adjust their expectations and strategies to adapt to an increasingly competitive industry.
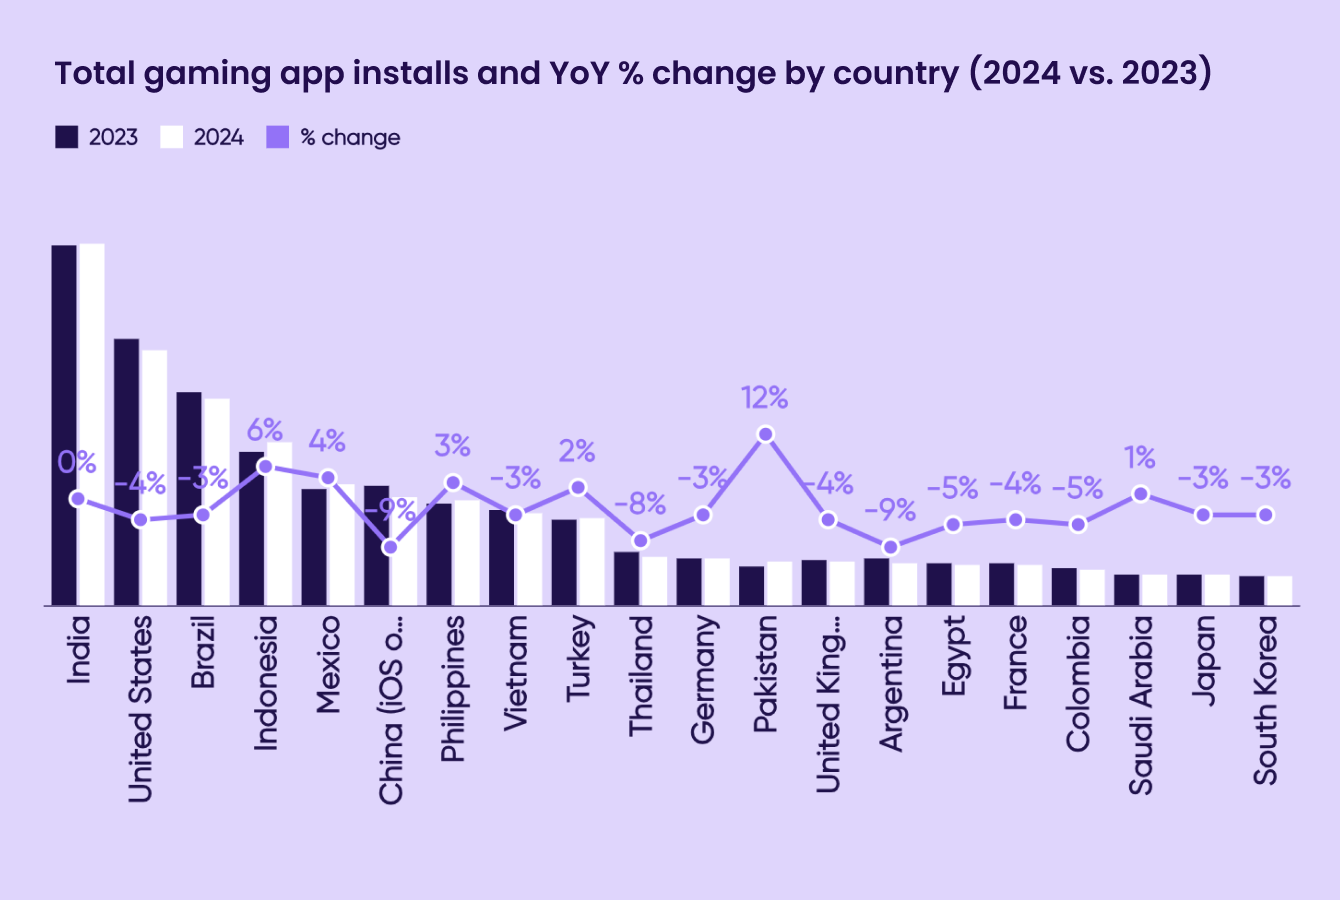
High-growth opportunities are waning for mobile games. Year-over-year, downloads have remained relatively flat worldwide, with most markets seeing minor dips or gains.
Tier-one markets like the US, Germany, Japan, and South Korea saw minor dips of less than 5 percent, while emerging markets like Mexico, Indonesia, and the Philippines saw gains of around 5 percent. Downloads also grew 12 percent in Pakistan between 2023 and 2024.
Gaming IAP revenue is primarily stagnant, but growth differs by category
Since 2021, mobile games looking for sustainable growth have had to become more creative about monetizing engagement. Most mobile games have invested in hybrid monetization with IAP as a key revenue source.
Overall, IAP revenue for mobile game app categories saw a slight 1 percent decline in 2024. However, growth has not been uniform across gaming categories.
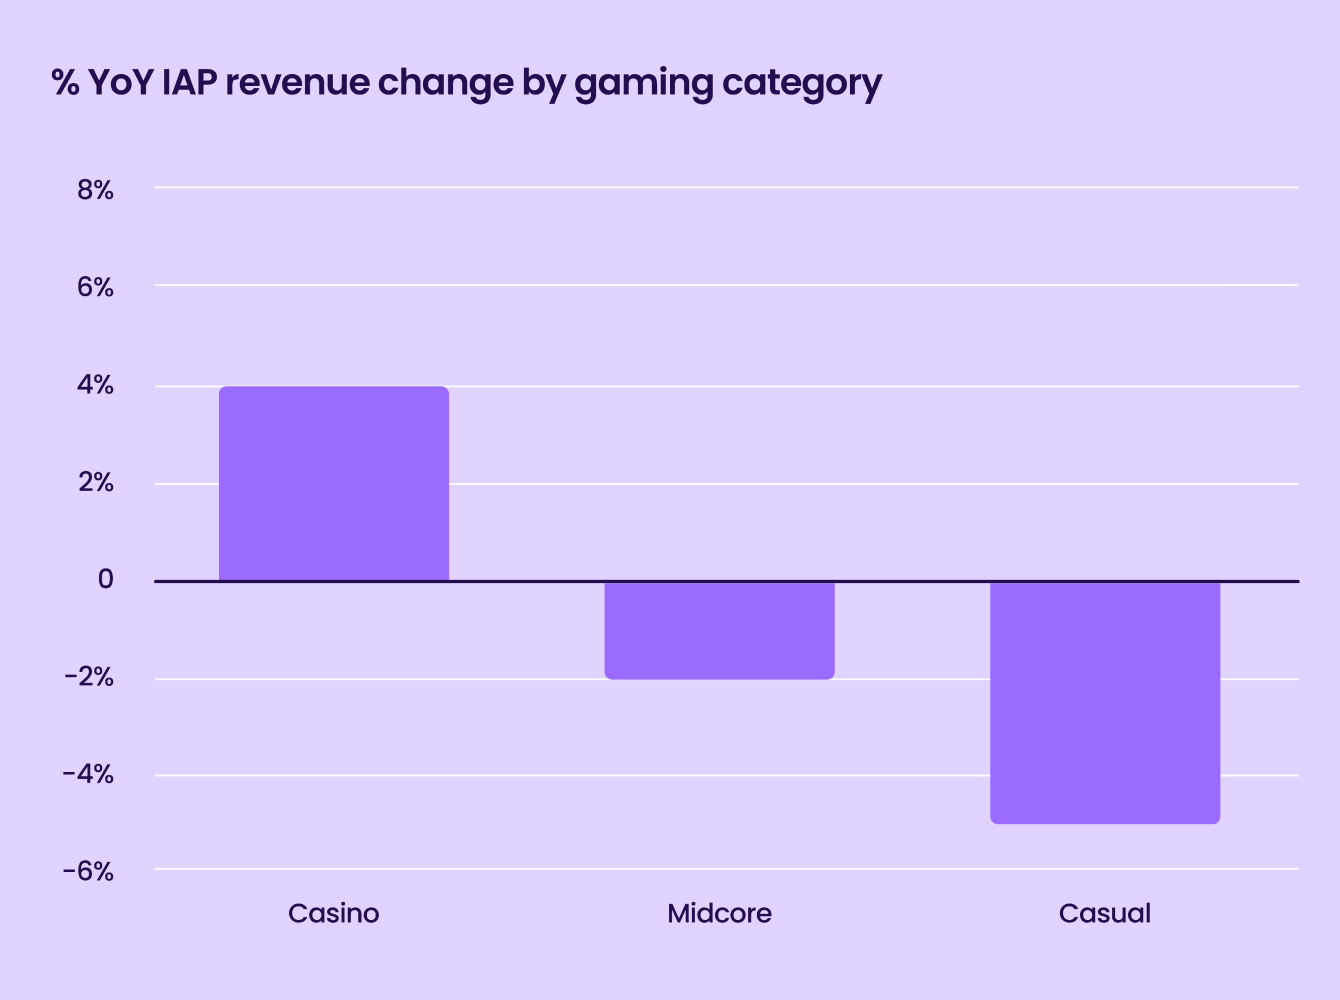
According to AppsFlyer data, casino games saw 4 percent growth between 2023 and 2024. IAP revenue for midcore games (which include genres like strategy, role-playing, shooter, etc.) and casual games (puzzle, party, action, match, simulation, tabletop, kids, etc.) both saw a negative change YoY, with casual games seeing a larger dip at 5 percent.
OUR SURVEY METHODOLOGY
In this changing climate for consumer apps and mobile games, we wanted to know what app marketers are experiencing day-to-day and how their priorities and perceptions align with macro trends.
We asked over 700 mobile marketers across different app categories about their perspectives on campaign performance in 2024, how their priorities are evolving, and their predictions for 2025.
The Respondents
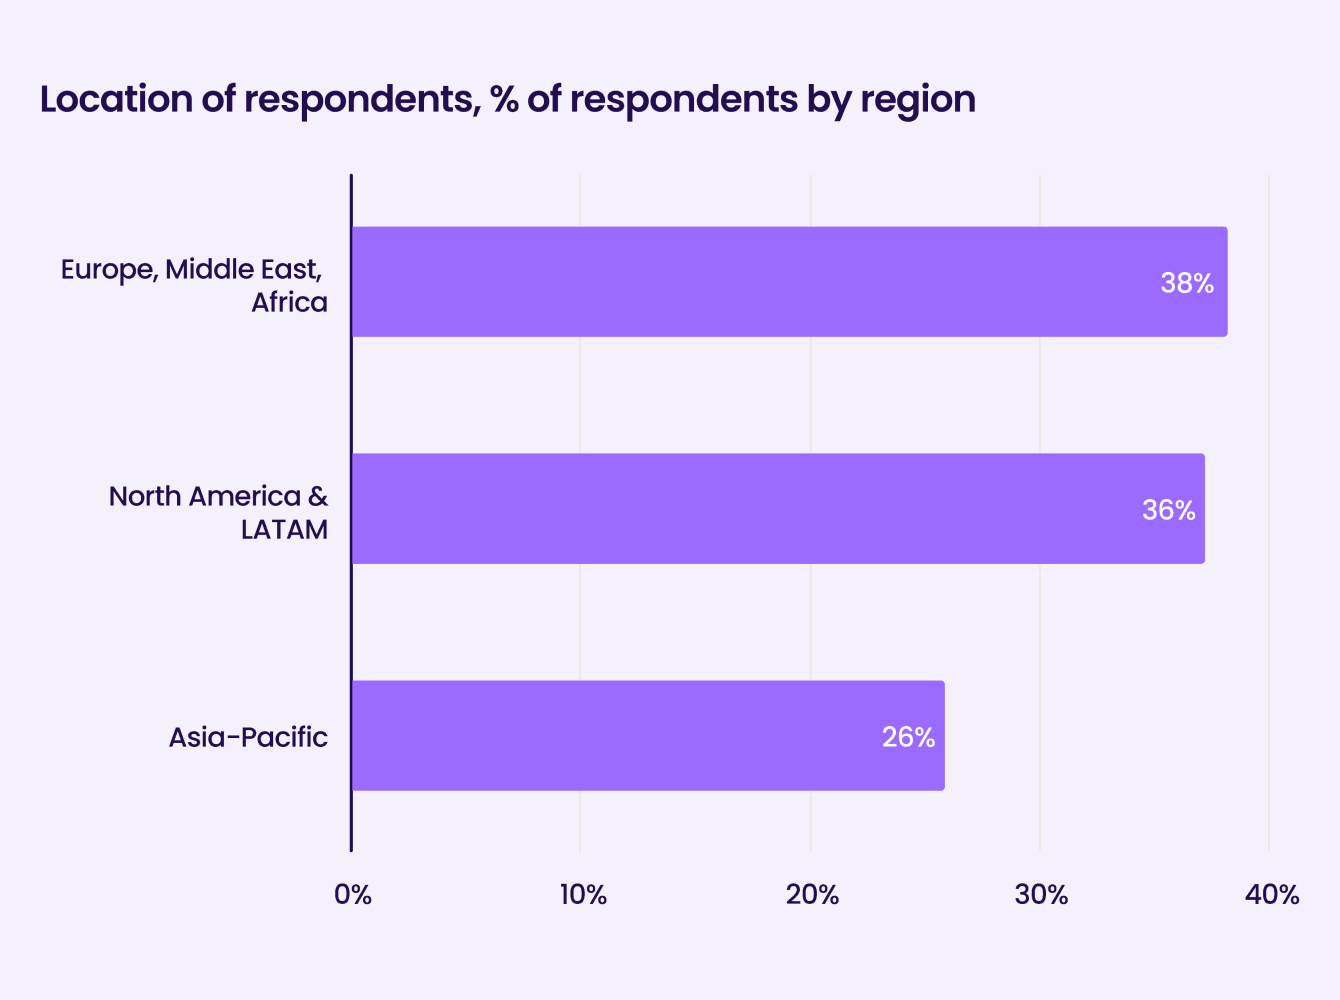
36 percent of respondents came from North and Latin America.
38 percent of respondents came from EMEA.
26 percent of respondents came from APAC.
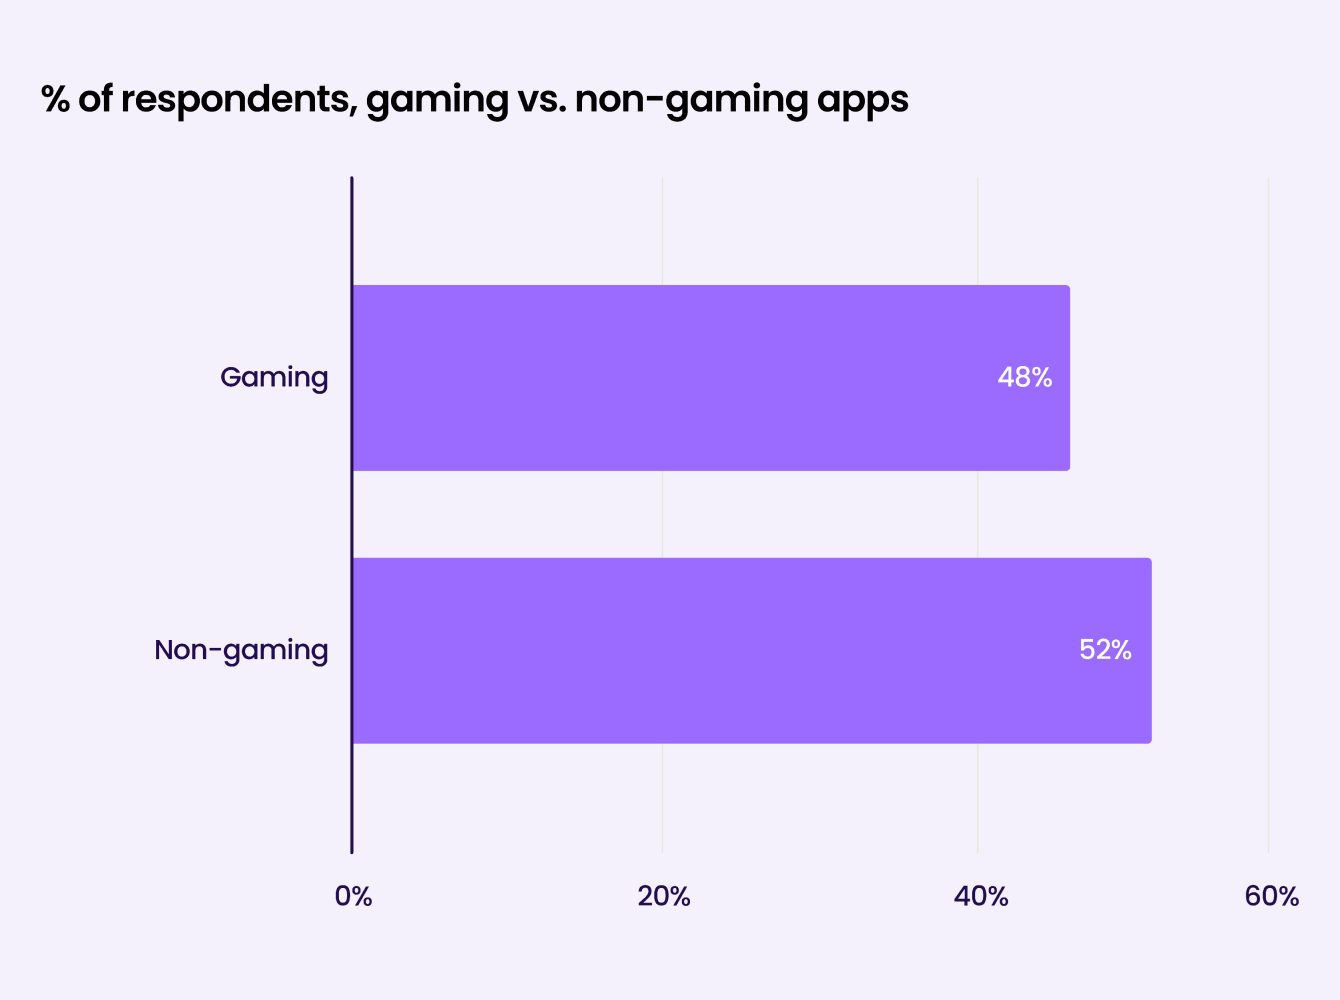
52 percent of respondents came from non-gaming app categories.
48 percent of respondents came from gaming app categories.
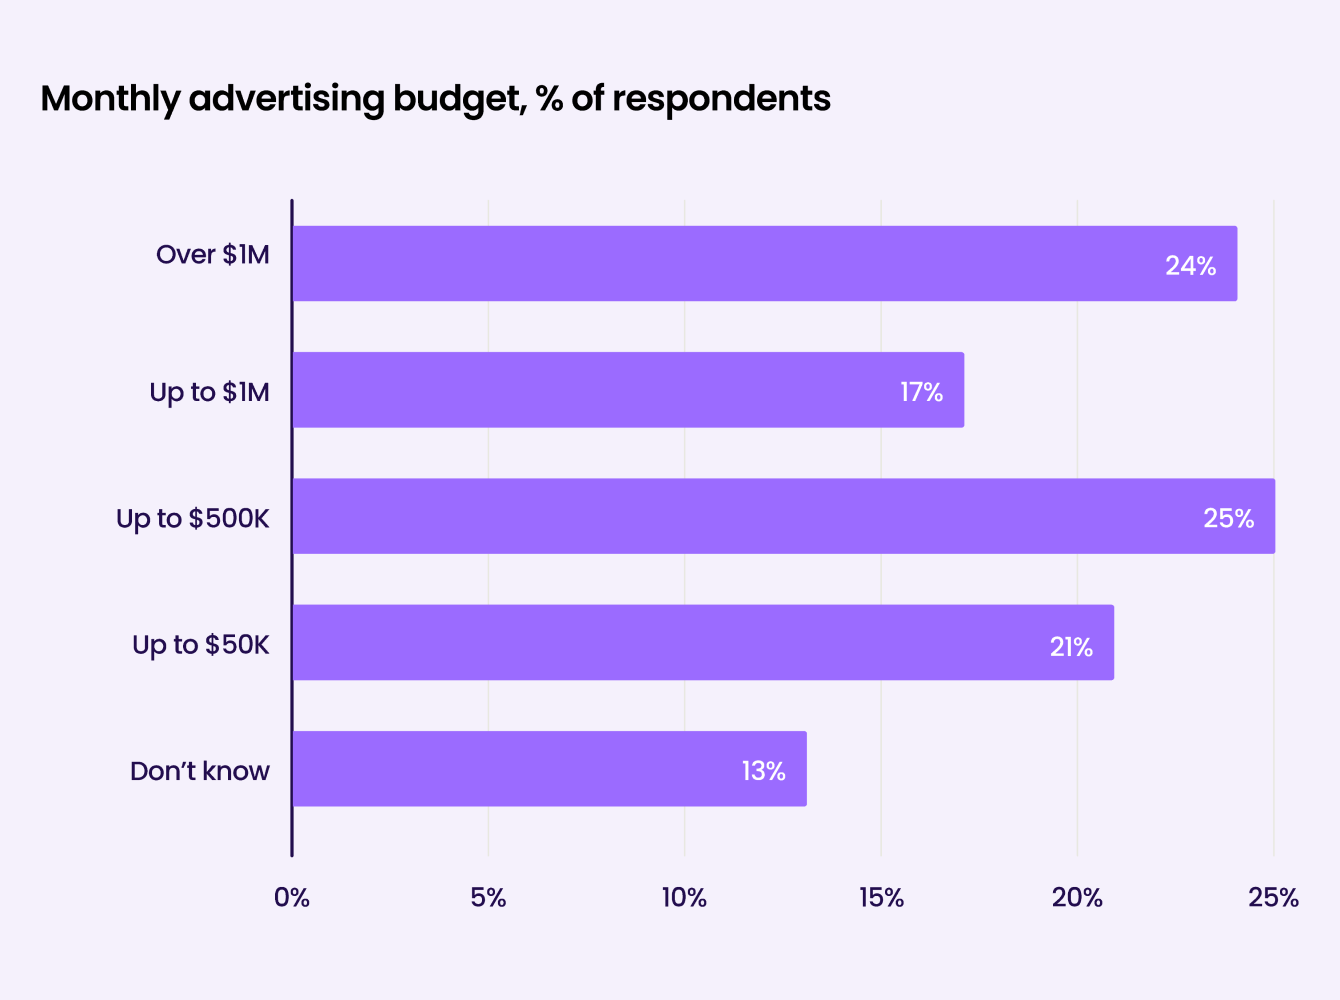
About a quarter of respondents work with monthly budgets of over $1M.
21 percent of respondents cite monthly budgets of $50K or less.
PULSE CHECK: THE INDUSTRY NOW VS. 12 MONTHS AGO
Most respondents agree that the past year has been better for the mobile marketing industry
2024 has seen positive developments overall, and we see this reflected in marketer sentiment. Over half of all survey respondents believe the industry is in better shape compared to December 2023, and nearly 80 percent agree that it’s the same or better.
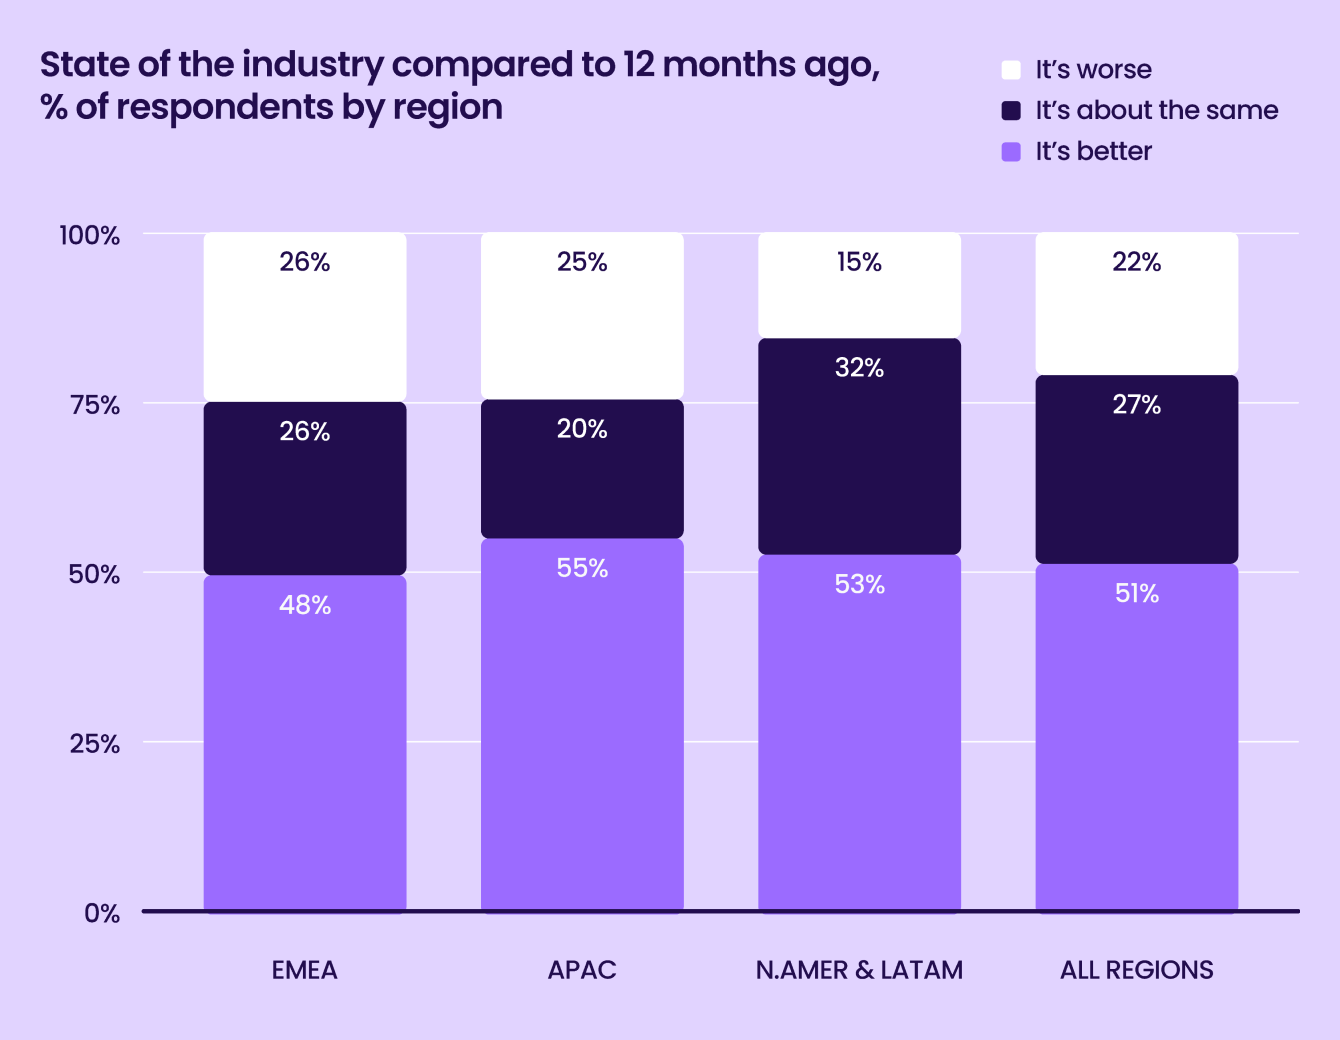
Looking by region, North American and LATAM respondents were the most upbeat, with 85 percent citing that the industry is the same or in better shape. EMEA respondents were marginally less optimistic, with 26 percent reporting that 2024 was worse.
When we consider survey responses about budgets, marketers who reported budget increases in 2024 were significantly more likely to report feeling upbeat about the industry’s state in 2024, suggesting a link between willingness to spend and positive market perceptions.
Compared to their gaming counterparts, non-gaming marketers are more hopeful about the state of the industry
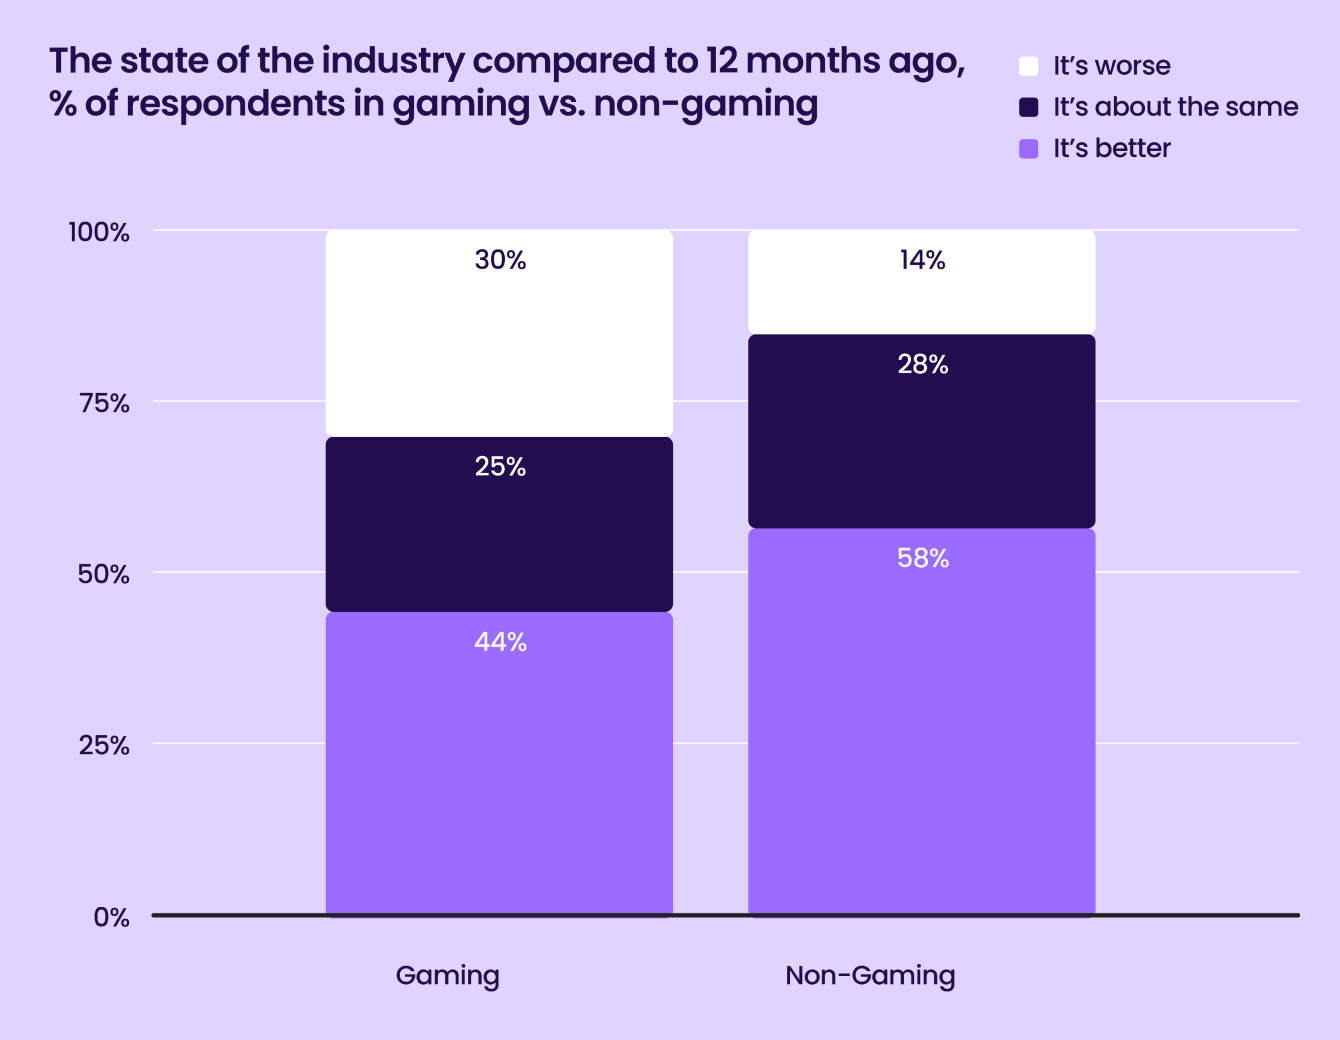
2024 was an outstanding year for non-gaming app revenue growth. By contrast, gaming revenues have been relatively flat, and the industry’s landscape is changing, leading to greater uncertainty. This uncertainty is reflected in the survey responses. 30 percent of respondents believe the state of the gaming app industry is worse compared to 44 percent, who say it’s doing better.
We see more widespread optimism among non-gaming respondents, with over 86 percent of non-gaming respondents saying that the industry is in the same shape or better.
Over half of marketers report more aggressive KPIs year-over-year
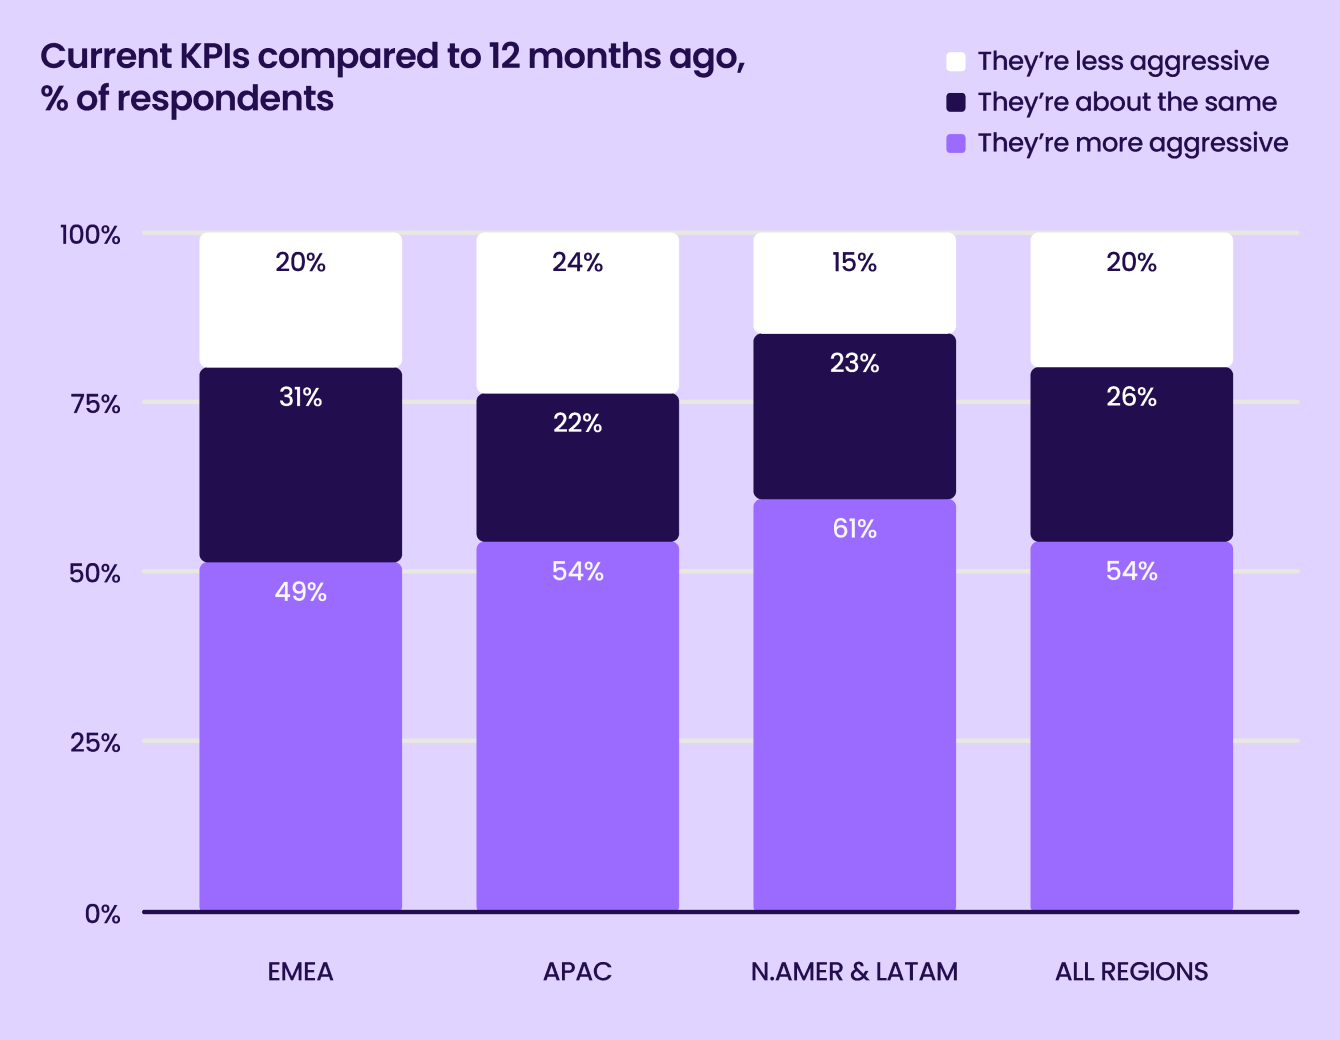
As the push for new users becomes more competitive, companies are under pressure to deliver consistent revenue growth. Over half of survey respondents report more aggressive KPI targets for the second year in a row.
We see the biggest shift in North America and LATAM respondents, with 61 percent of respondents citing more aggressive targets YoY. 31 percent of EMEA respondents reported that their KPIs were roughly the same, compared to 22 percent and 23 percent in the other two regions. This may reflect regional differences in market maturity and competitive dynamics.
A majority of non-gaming marketers report more aggressive targets while gaming marketers are more divided
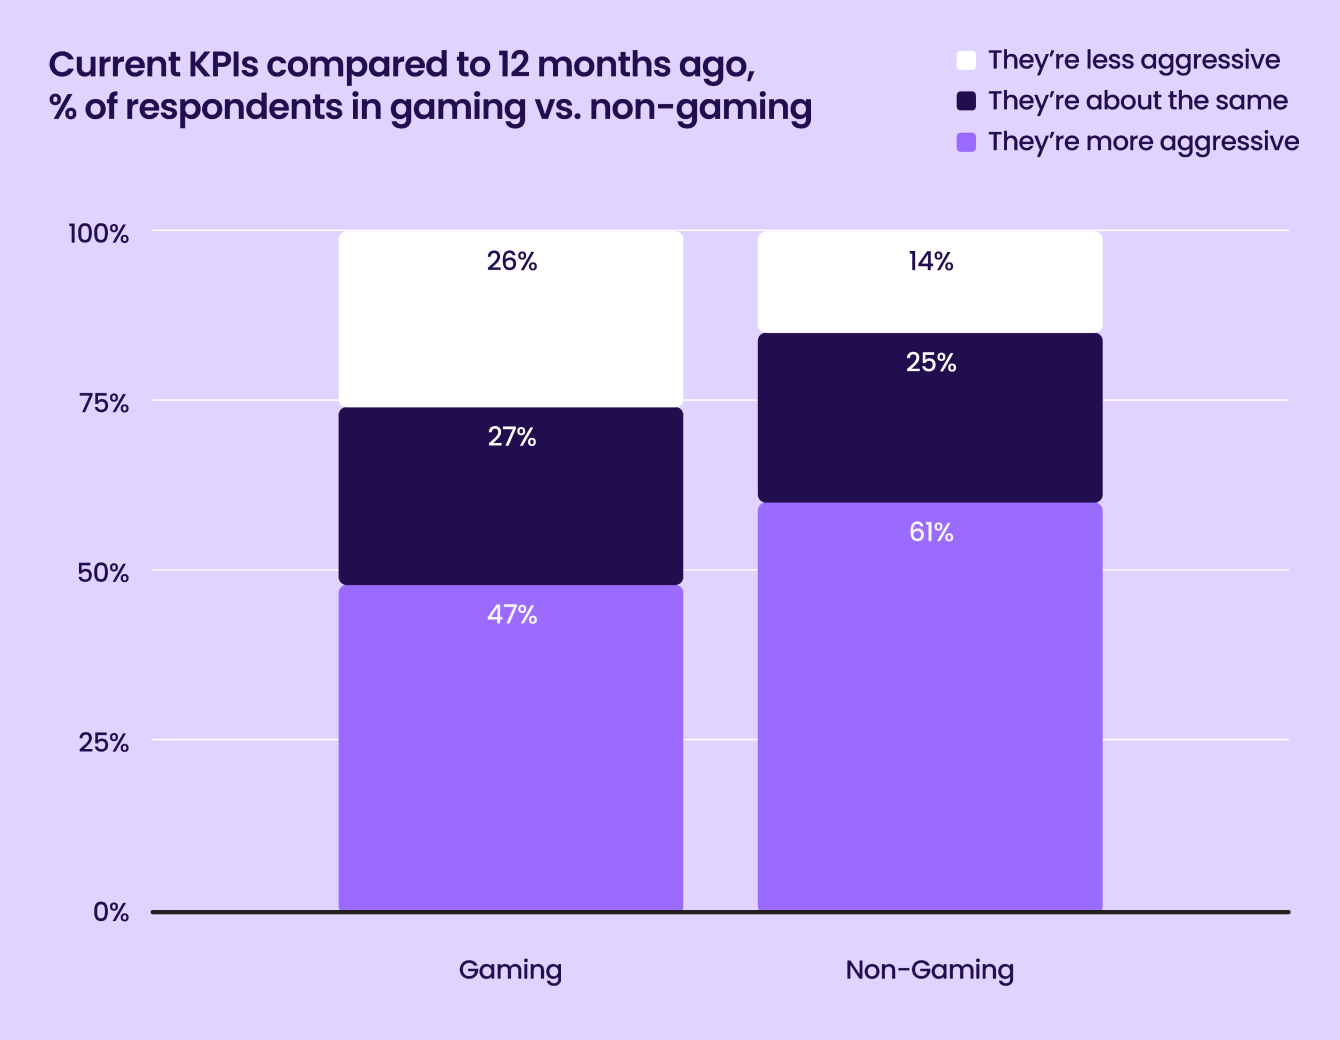
Comparing gaming and non-gaming marketers, we see that most non-gaming marketers are responding to a year of revenue growth by setting ambitious KPI targets.
61 percent of non-gaming respondents report setting more aggressive KPI targets, compared to just 47 percent of gaming marketers. 26 percent of gaming marketers report KPIs that are less aggressive YoY compared to just 14 percent of non-gaming marketers.
While divided about KPIs, both gaming and non-gaming marketers are reaching their targets
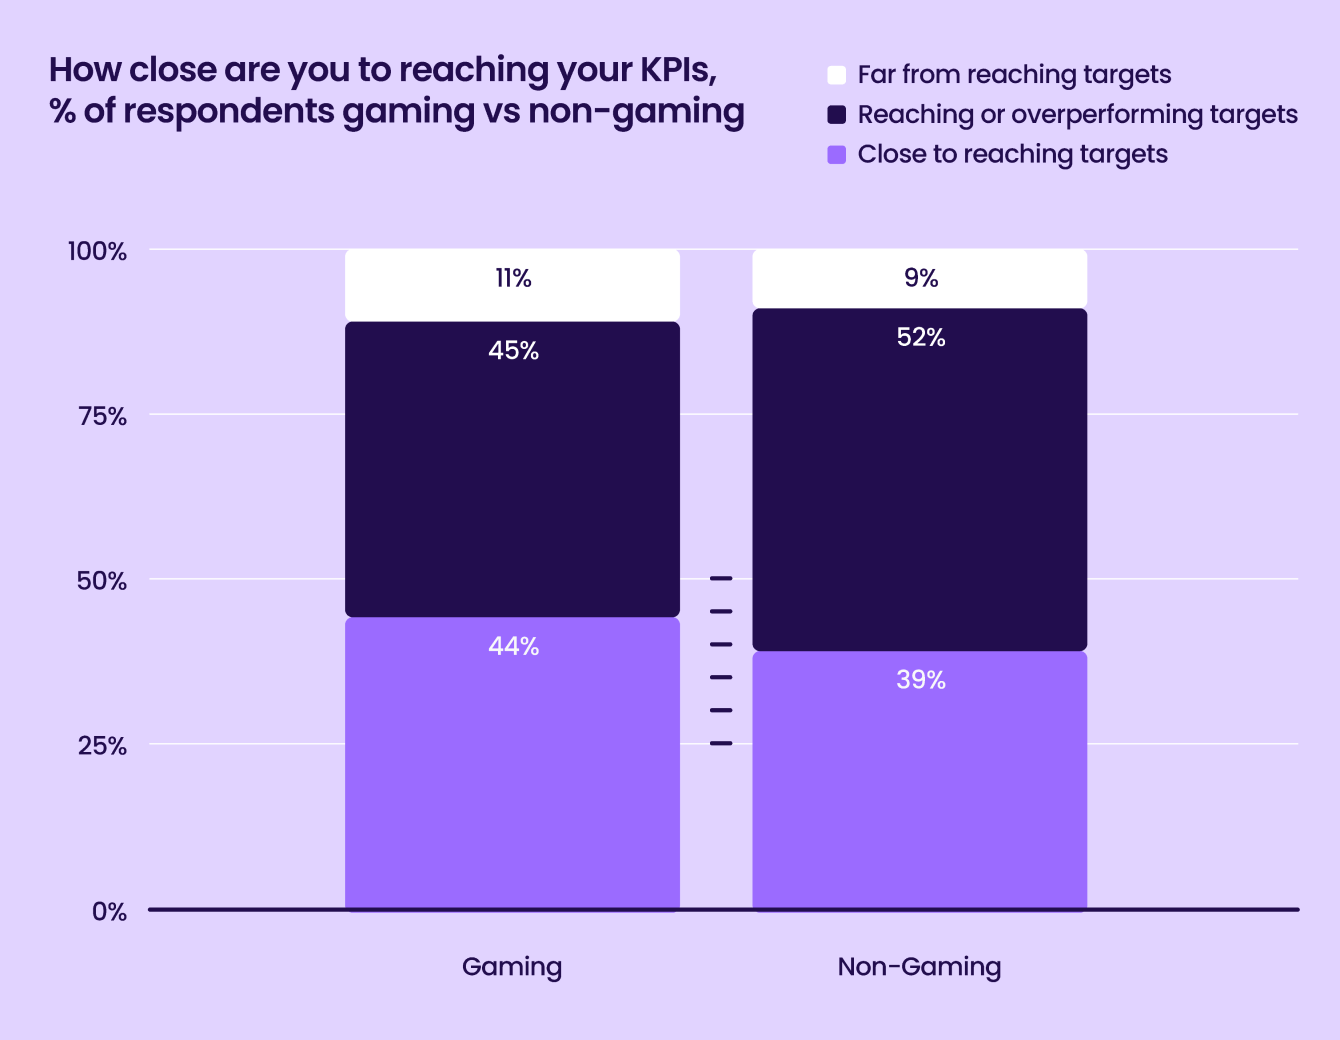
While marketers differ on how aggressive their KPIs are, most are seeing performance keeping up with KPI goals.
~90 percent of gaming and non-gaming marketers report they are at least close to reaching KPI targets. Over half of non-gaming respondents report reaching or overperforming their targets, and 45 percent of gaming respondents are either reaching or overperforming.
Budgets are growing to support ambitious KPIs
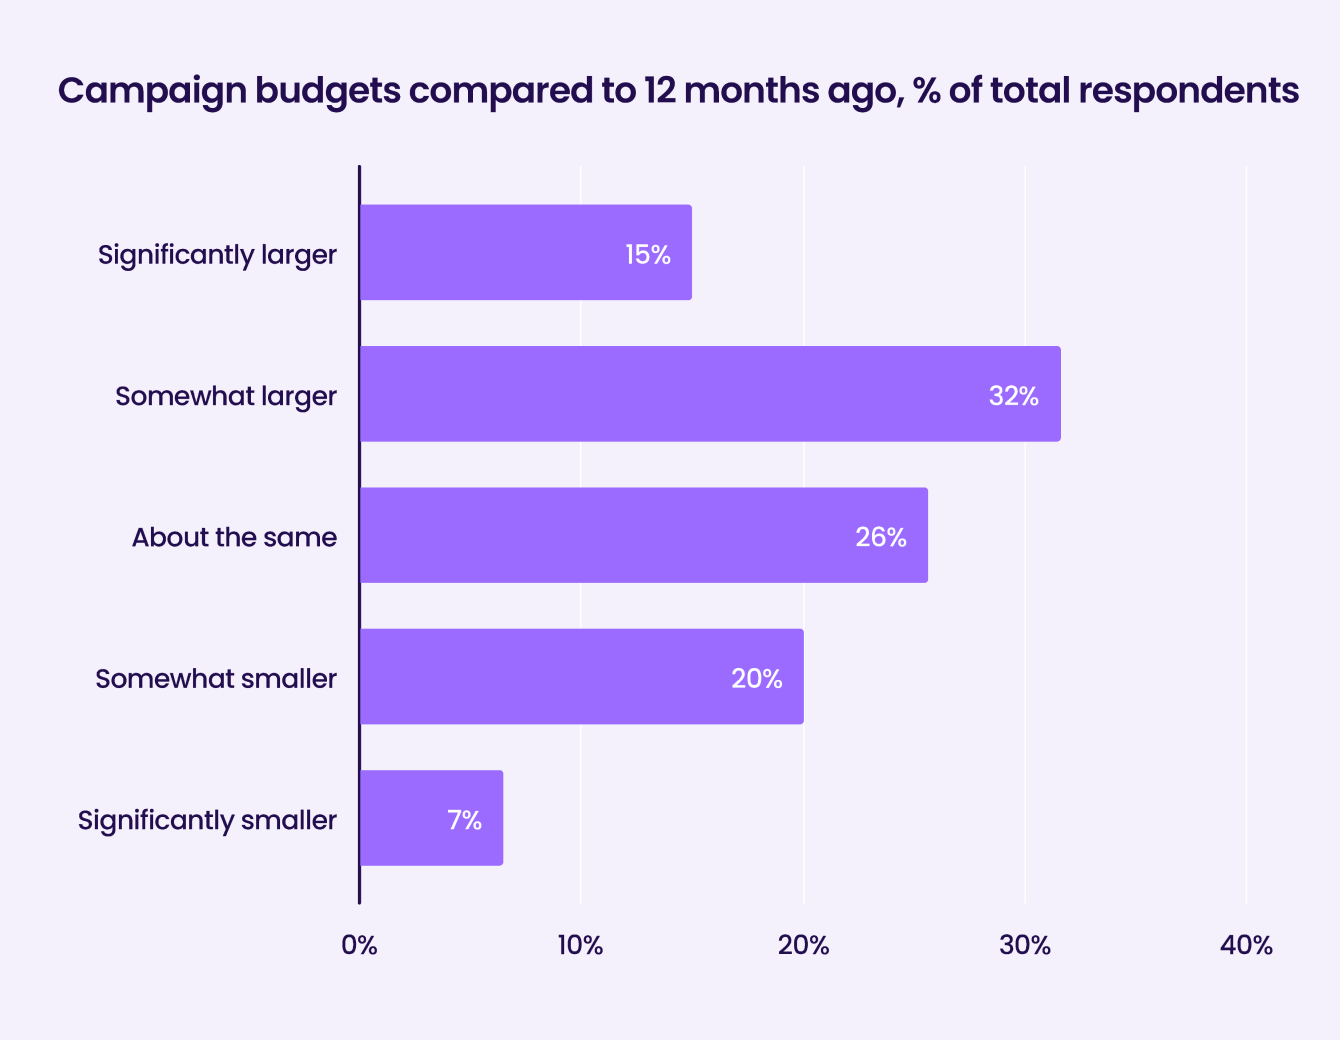
A sign of increased competition—and an increased willingness to spend—nearly half of respondents report a larger or significantly larger budget than 12 months ago. Only 27 percent of those surveyed report a smaller budget than the previous year.
Interestingly, when considering the size of the budget, marketers from companies with budgets over $1M were more likely to report significantly larger increases than those in lower budget tiers, indicating that resource-rich firms are consolidating their position in the market.
According to marketer responses, KPIs are becoming more aggressive year-over-year, and across the board, UA performance is keeping up despite a competitive environment. 90% of those surveyed say that they are close to or reaching their KPIs. This speaks to the speed and depth of innovation in ad tech. As ML models evolve, they can accommodate more customized requirements. The latest ML models can more effectively target audiences that are likely to engage with the unique features of different apps. This leads to more conversions and improves retention. As ad budgets grow in 2025 and marketers evaluate where to allocate their spend, they should look for partners with a customized approach and robust technology offerings capable of delivering top performance.Joey Fulcher, SVP, Global Demand Sales, Liftoff
SHIFTING LANDSCAPES
For most app marketers, profitability is the top priority
The app marketing business has changed a lot over the past five years. So, we asked respondents what their top priorities are for their marketing campaigns.
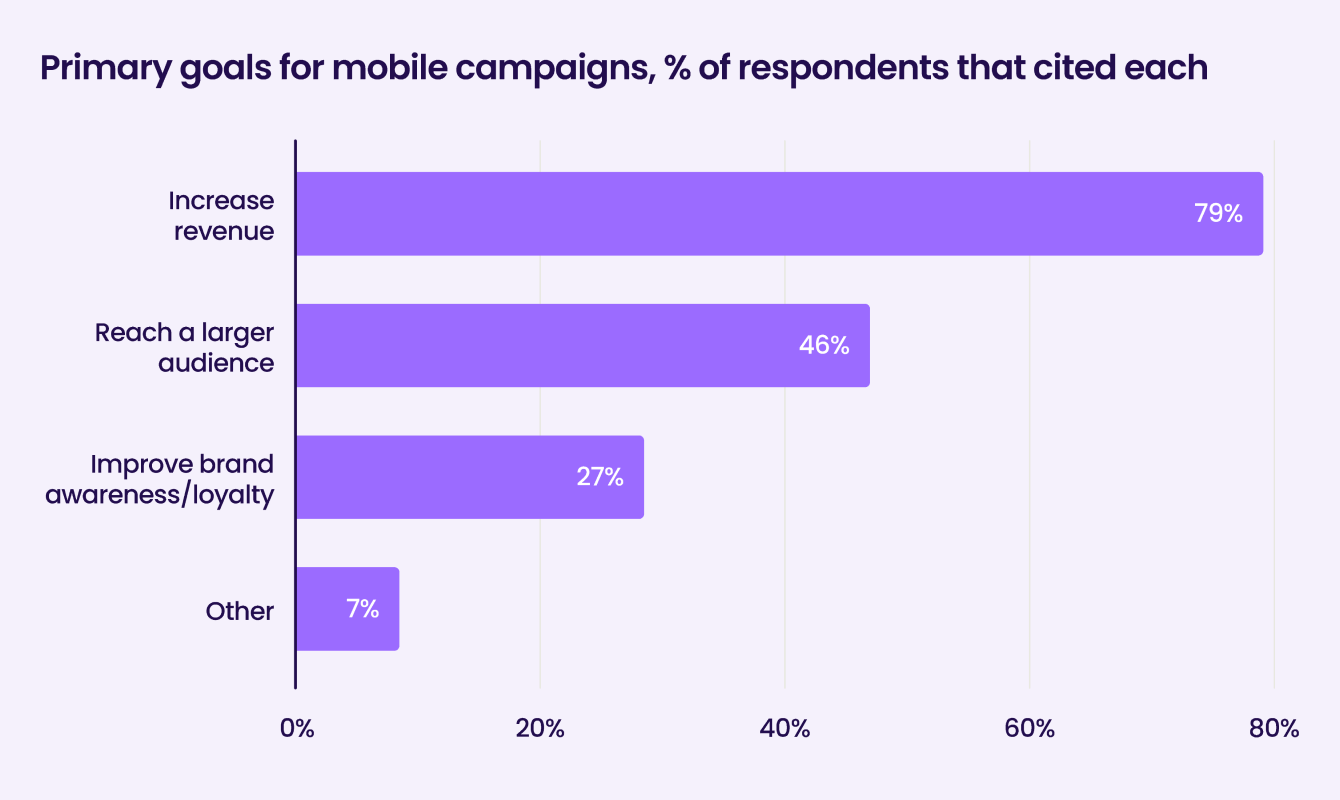
The answers reflect a continuing emphasis on profitability. Nearly 80 percent of respondents cite “increase revenue” as a key priority. As external investment dries up, growth-at-all-costs models have disappeared, and sustainable growth is top-of-mind.
That said, scale is still a key part of growth. 46 percent of respondents cited reaching a larger audience as a primary goal. 27 percent included improving brand awareness and loyalty among their top goals. These respondents predominantly work in app categories like education, finance, as well as food and drink. For these advertisers, loyalty and reputation are critical for retention and growth.
ROAS still reigns supreme, but CPA is top for many non-gaming marketers
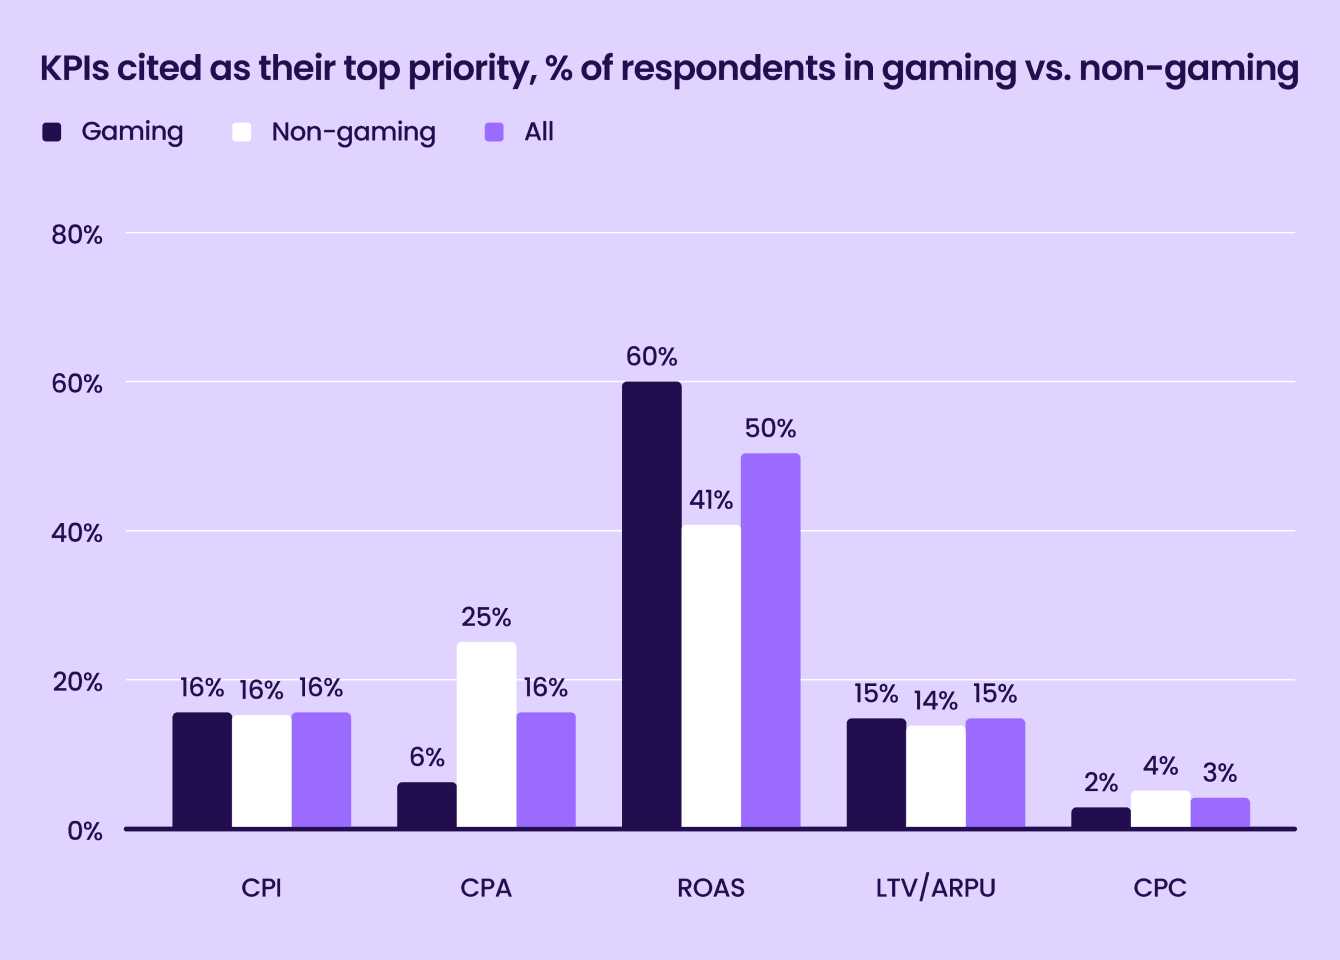
Which KPIs matter to marketers in 2025? It depends on who you ask. While most gaming marketers cited ROAS as their top metric, non-gaming marketers prioritized ROAS but were more split depending on their app category.
25 percent of non-gaming respondents cited CPA as their top metric, while only 6 percent of gaming marketers did. Unsurprisingly, marketers citing CPA as a top metric tended to come from finance, entertainment, and e-commerce app categories where key actions like signing up for an account or making a purchase are better indicators of user acquisition.
The breakdowns were much closer for other metrics, with 16 percent of gaming and non-gaming marketers citing CPI as their top priority. LTV/ARPU is increasingly popular as a metric for longer-term profitability. About 15 percent of both groups cited it as a top consideration.
Mobile audiences are evolving, but not for everyone
As the mobile market expands and smartphone penetration grows in new markets, the audience for many mobile apps is also shifting as they scale. We asked marketers how their audience looks compared to two years ago.
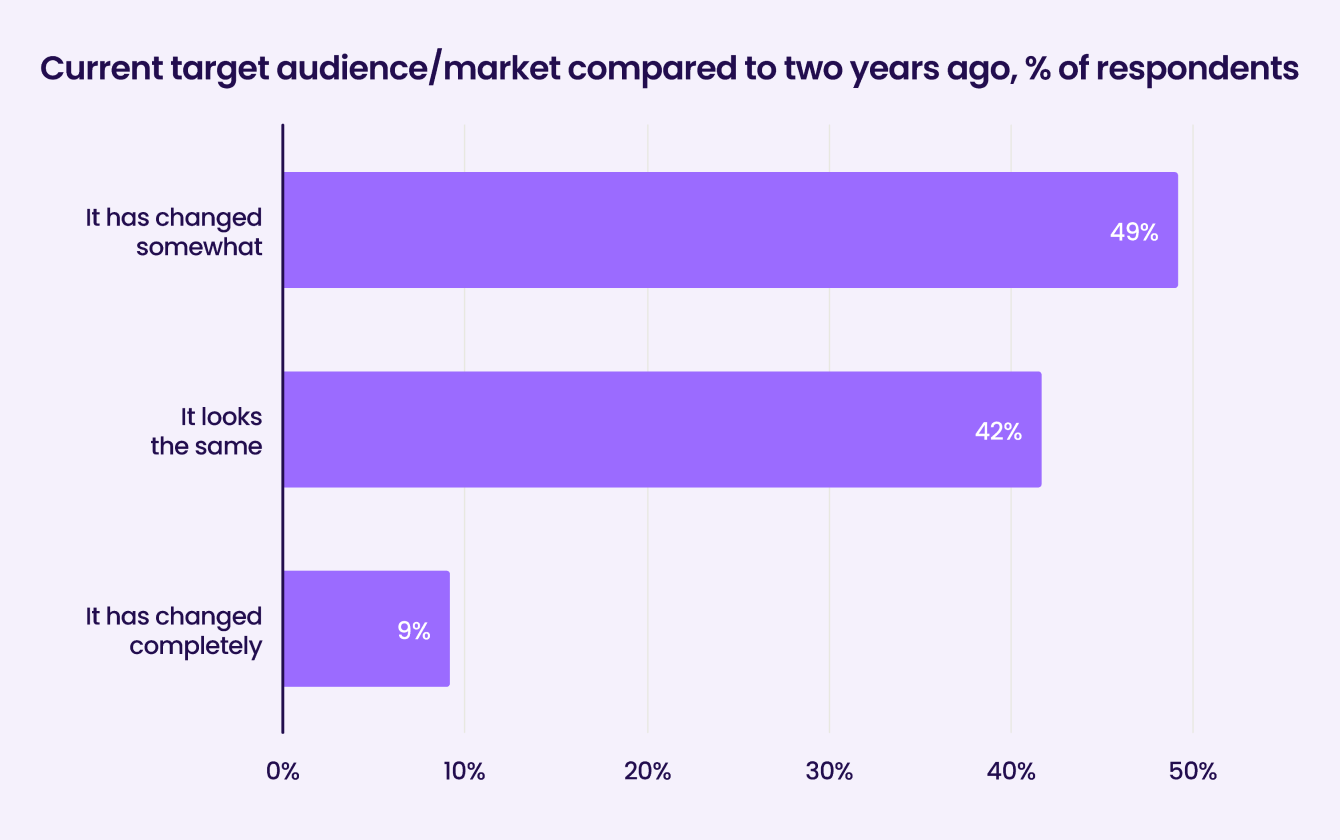
58 percent of respondents report that their target audience or market has changed since 2022. 9 percent said that their audience has changed completely.
Many respondents who report a changing audience came from gaming and entertainment app categories. This is likely due to ongoing shifts in consumer behavior and the sectors’ focus on audience expansion powered by more aggressive advertising strategies.
Marketers are eyeing re-engagement on iOS as an underleveraged opportunity
Immediately post-ATT, there were questions about whether re-engagement campaigns would be phased out entirely. Years later, while running re-engagement campaigns on iOS has become more complex, they remain a crucial revenue driver for many apps.
Following the rollout of Apple’s AdAttributionKit, which has added capabilities specifically for re-engagement, we wanted to gauge how marketers are currently approaching re-engagement on iOS.
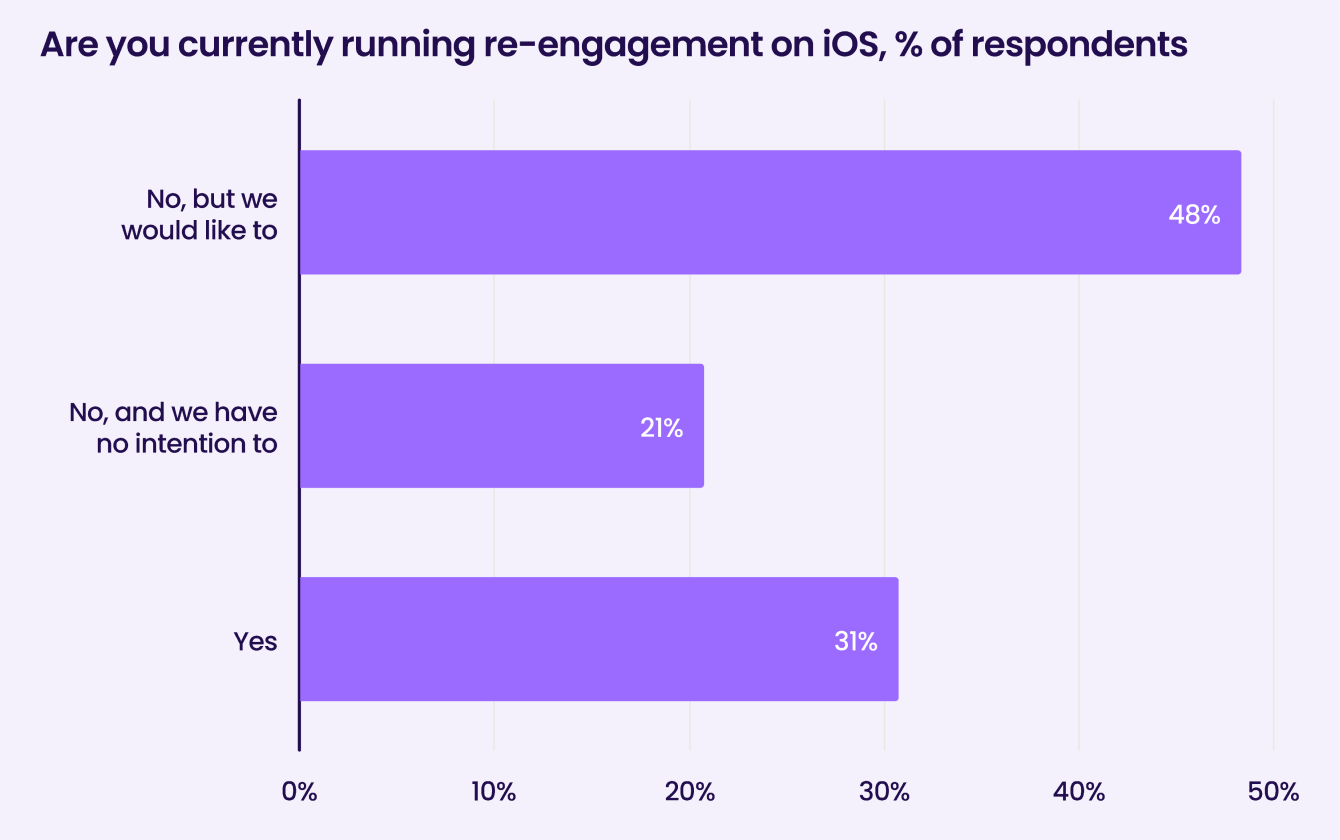
Only 31 percent report running re-engagement on iOS. Interestingly, about half of the respondents report that they are not currently running re-engagement campaigns but would like to start, indicating that Apple is paying attention to feedback with SKAN and its updated AdAttributionKit frameworks. A further 21 percent have no intention of starting.
Creative production and optimization seeing the most benefits from gen AI
After a crucial year for gen AI, we wanted to know where marketers already see the benefits of new AI technologies.
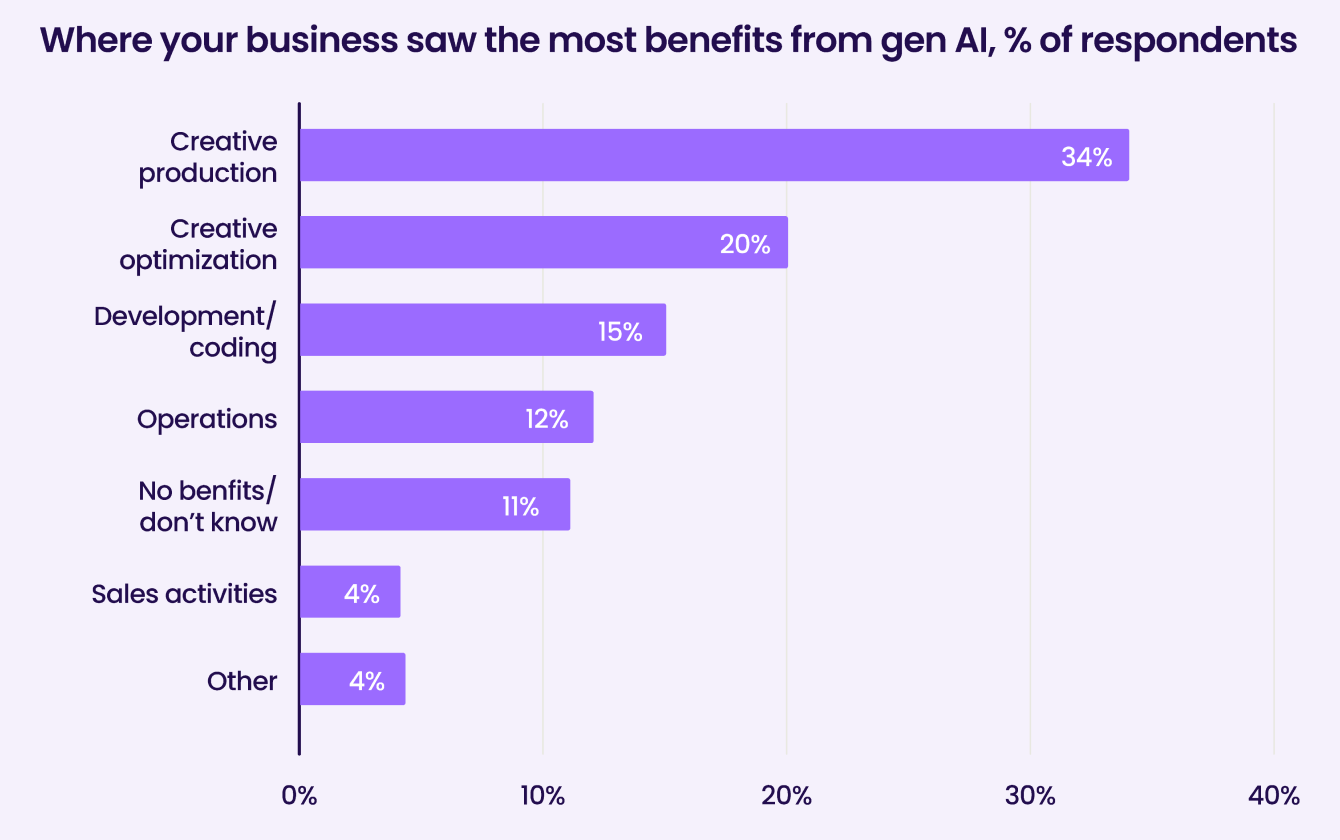
While we anticipate more challenges with product updates and organizational adoption, generative AI is definitely having an impact. Over half of respondents cited creative production and creative optimization as the areas where their business saw the most benefits.
15 percent report seeing the most benefits in development and coding. Fewer than 5 percent cited sales activities. For about 11 percent of respondents, the business benefits of gen AI may still be a “wait and see.”
SKAN & GAID
Marketers have some familiarity with Apple’s AdAttributionKit
Following SKAN 4, Apple released AdAttributionKit (AAK) last year in lieu of the anticipated SKAN 5. AAK is, in short, an attribution framework that enables broader ad attribution capabilities while addressing privacy requirements across multiple markets.
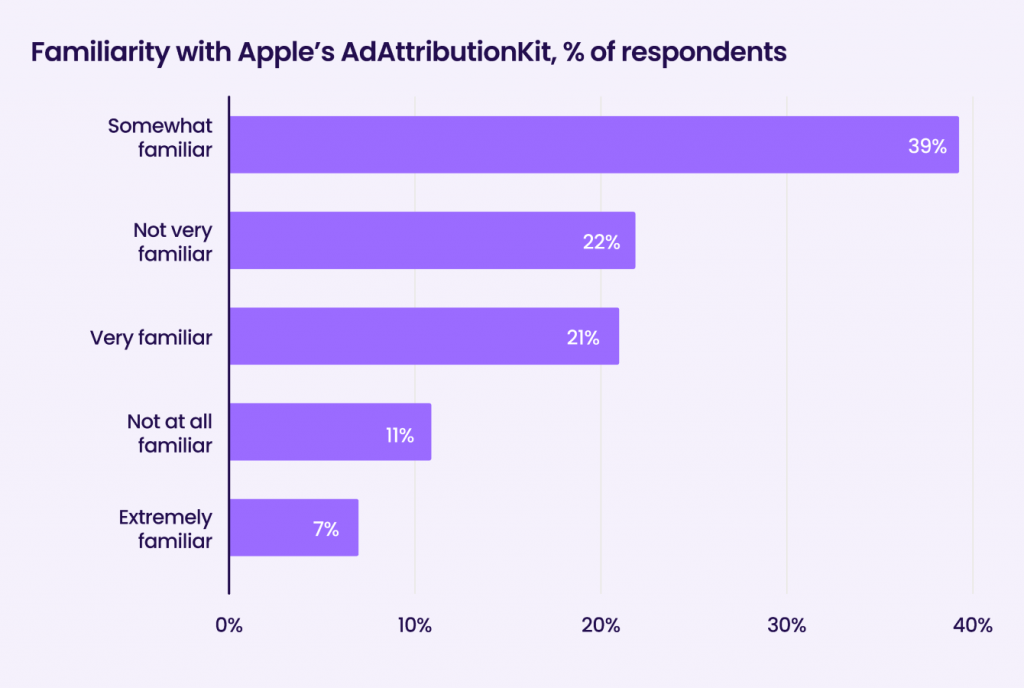
67 percent of respondents cite at least some familiarity with AAK, while only 11 percent are not at all familiar with the update. AAK and SKAN are interoperable, and in many ways, the update resembles what marketers expected for SKAN 5. As a result, it’s no surprise that most respondents are somewhat familiar.
Three years on, many marketers are still struggling to see success with SKAN
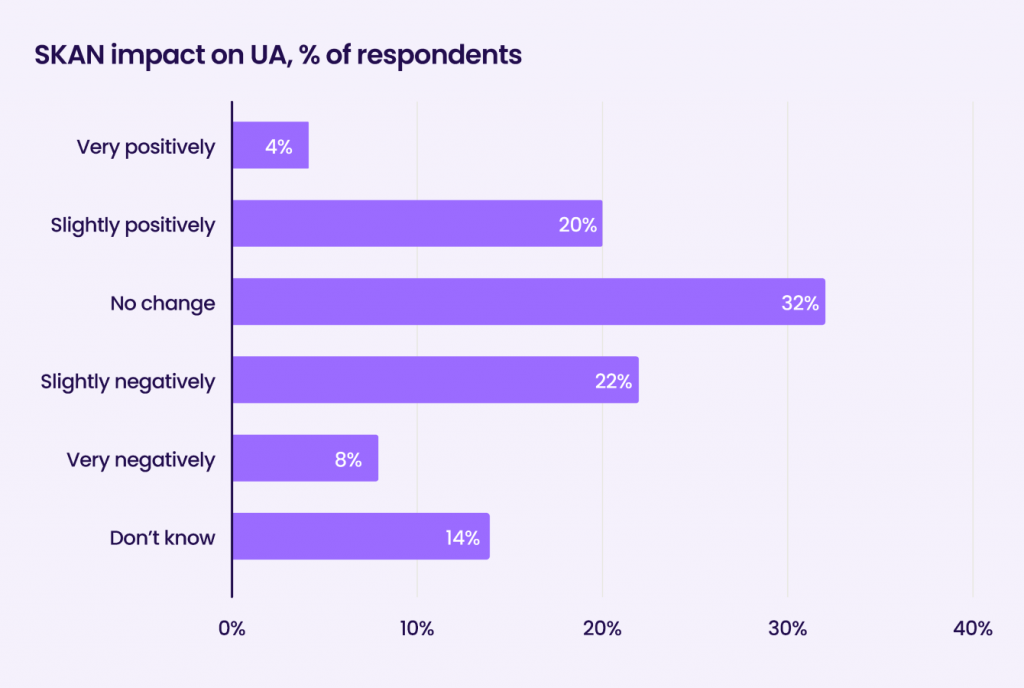
As for making SKAN work, marketers remain split on the performance they see. 32 percent of respondents report no impact on their iOS UA efforts, while 30 percent still face challenges and experience a negative impact. Only a quarter report SKAN having a noticeably positive impact. 14 percent of respondents do not know.
We also asked survey respondents which metrics are the deciding factors for the budget marketers allocate to SKAN.
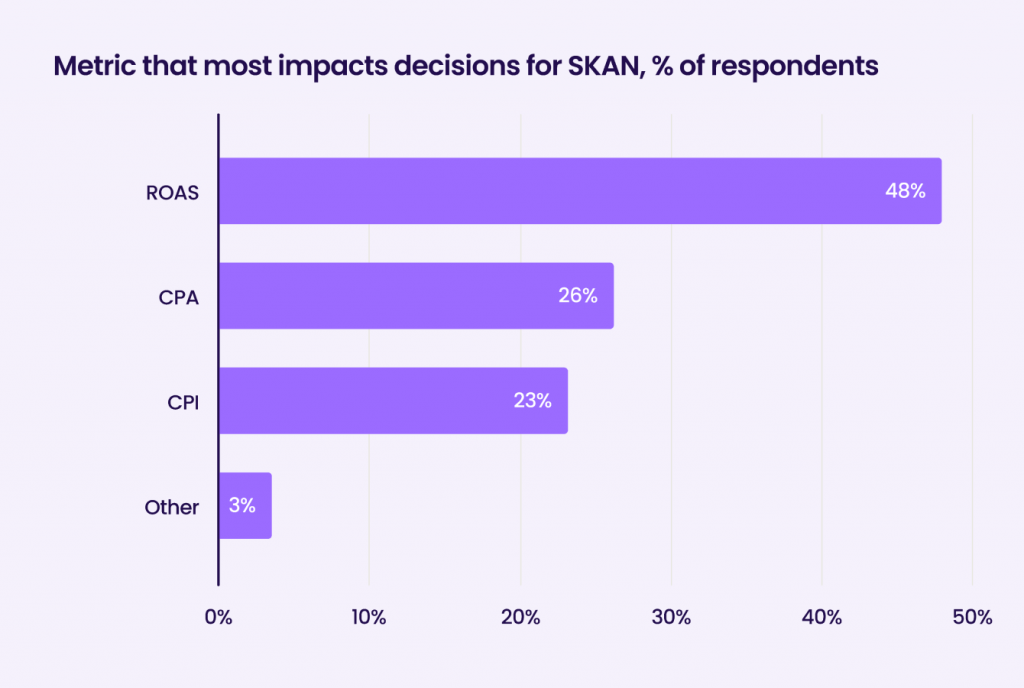
Unsurprisingly, about half of respondents cited ROAS as their determining metric, which aligns closely with findings about which KPIs respondents prioritize.
26 percent cited CPA, while 23 percent of respondents cited CPI. A further 3 percent listed other metrics like CPC.
GAID preparedness remains a “wait-and-see” for most marketers
In 2024, Google made a surprising U-turn when it indefinitely postponed its plans to phase out third-party browser cookies. Questions remain about whether GAID (Google’s mobile advertising ID) deprecation will go forward and what lessons it might take away from Apple’s ATT rollout. We asked respondents whether they were prepared for GAID deprecation. Compared to previous years, there has been little change.
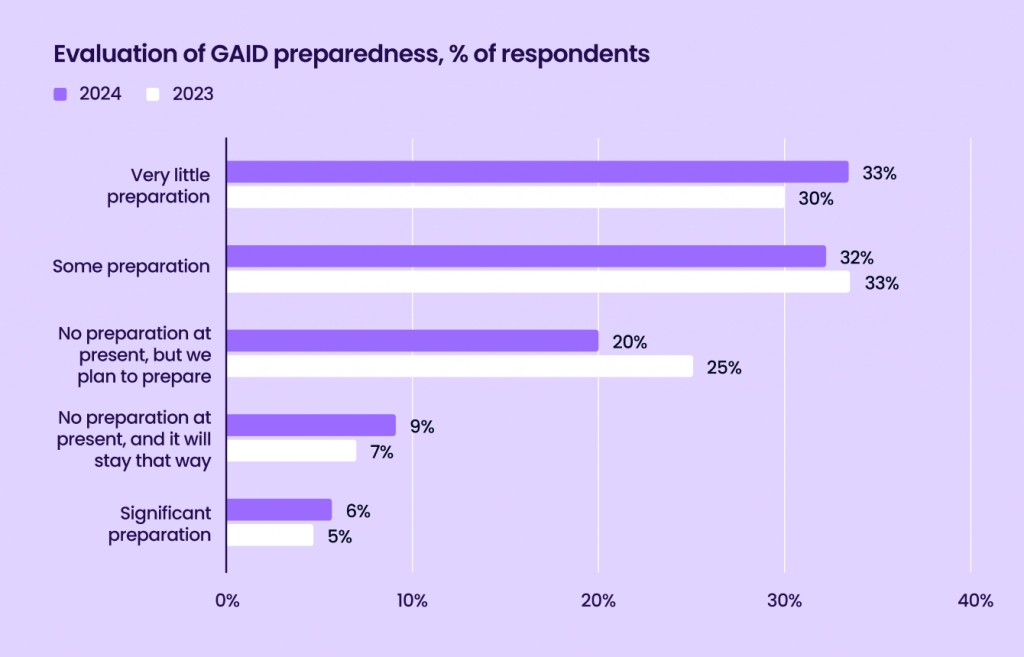
Only 32 percent of respondents have done some preparation, 33 percent report very little preparation, and nearly 10 percent have done no preparation and do not plan to prepare.
Larger firms with marketing budgets over $1M tend to be more proactive. With greater resources, they can plan ahead for early adoption of regulatory changes and are under greater pressure to be prepared.
2025 EXPECTATIONS AND PRIORITIES
Marketers are optimistic about 2025
Overall, marketers expect positive outcomes this year. 80 percent of those surveyed expect 2025 to be the same or better than the previous year.
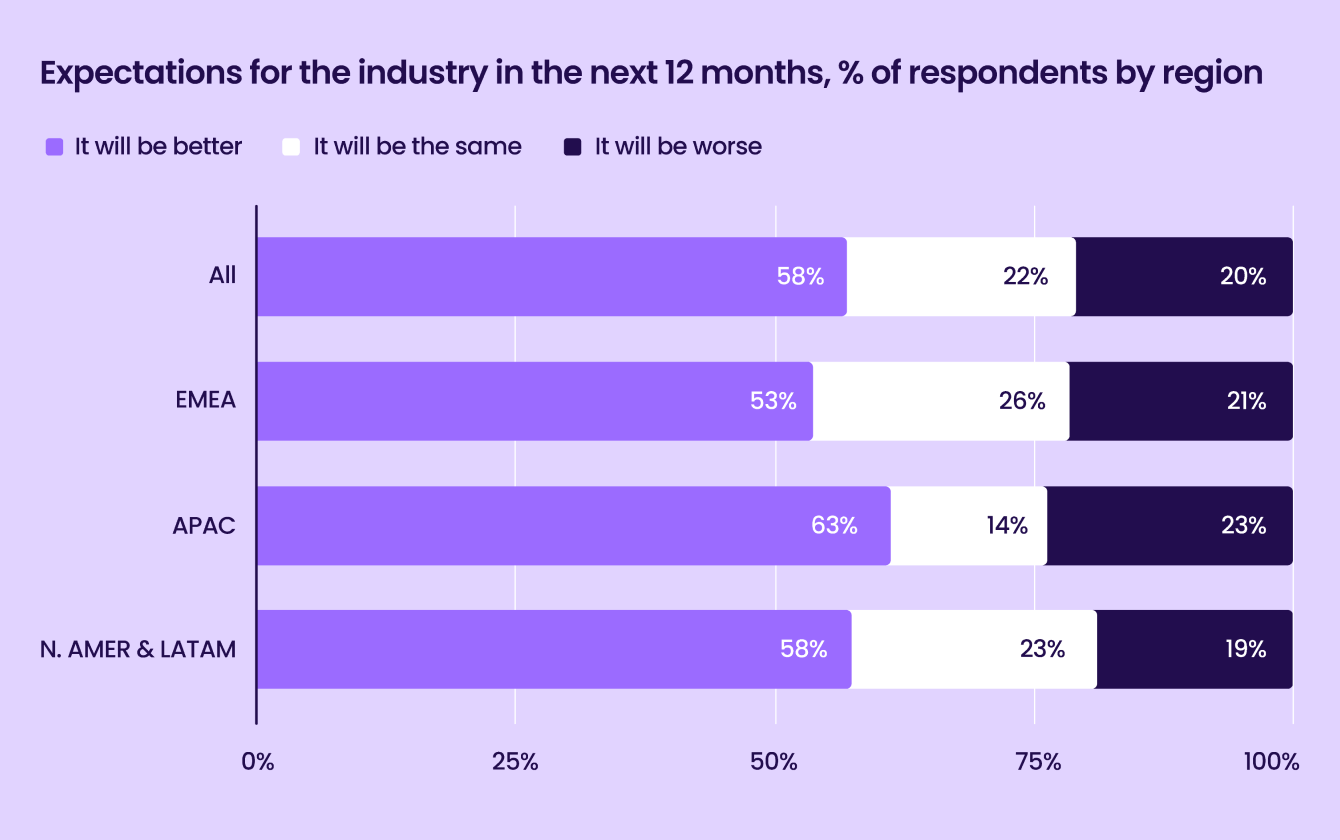
We see a similar 80-20 split across all regions, with most respondents expecting 2025 to be the same or better. APAC respondents were comparatively more divided than other regions, with 63 percent expecting 2025 to be better but 23 percent expecting a worse year.
EMEA respondents were comparatively more measured, with 26 percent expecting the new year to be about the same and 53 percent expecting it to be better.
A sign of high expectations in a competitive environment, over 60 percent of respondents expect to spend more
Ahead of a competitive Q1, we asked survey respondents about their ad budgets for 2025. Budgets look healthy, with 88 percent of respondents planning to spend the same or more in 2025.
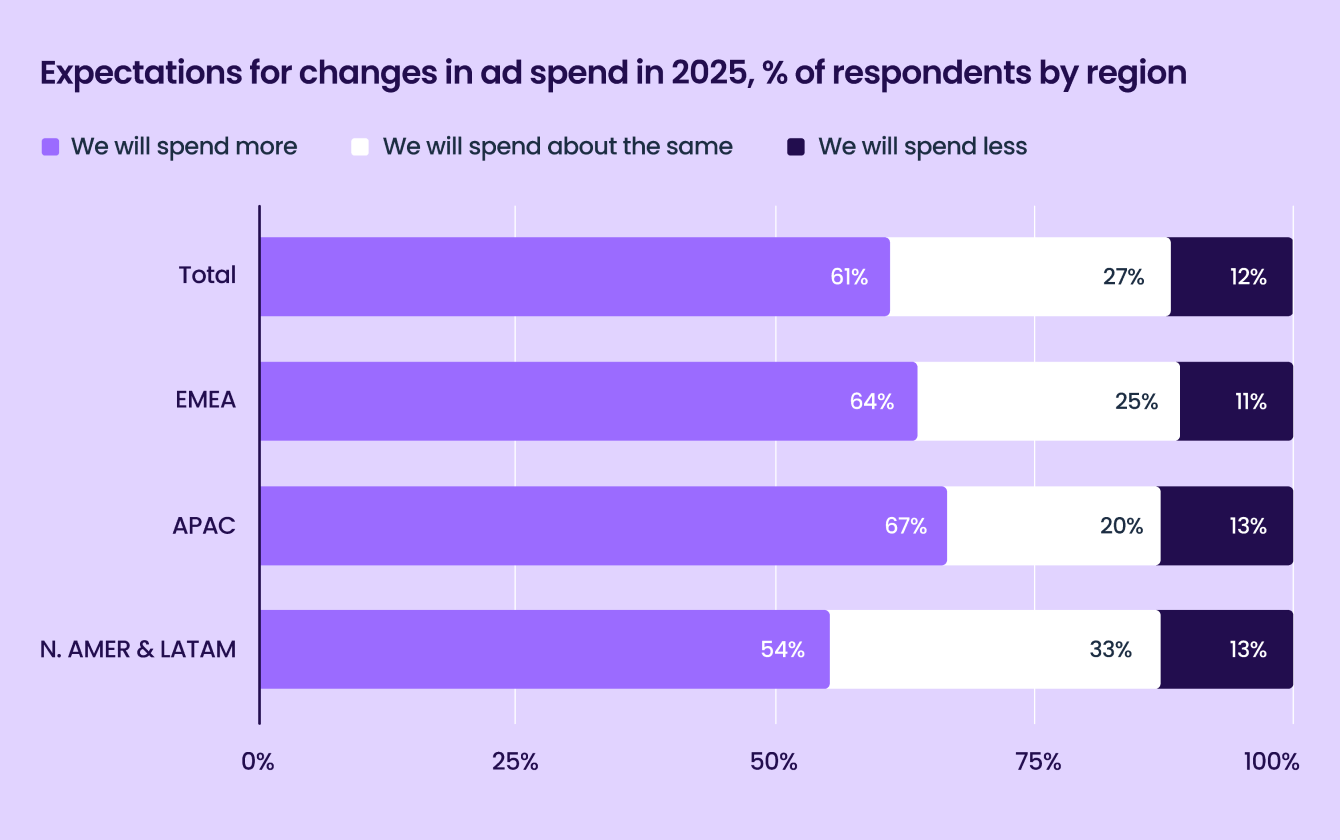
Broken down by region, APAC boasts the largest percentage of marketers who expect to spend more at 67 percent.
By contrast, 54 percent of respondents from North America and LATAM expect their budgets to increase, while a third of respondents from the region expect their budgets to stay the same. Across all regions, only 12 percent of respondents expect their budgets to decrease.
Most marketers still cite ad networks or self-attributing networks as their ad spend top priority for mobile user acquisition
Marketers expect to spend more in 2025, but where will they allocate their spend? We asked respondents to rank what they planned to prioritize.
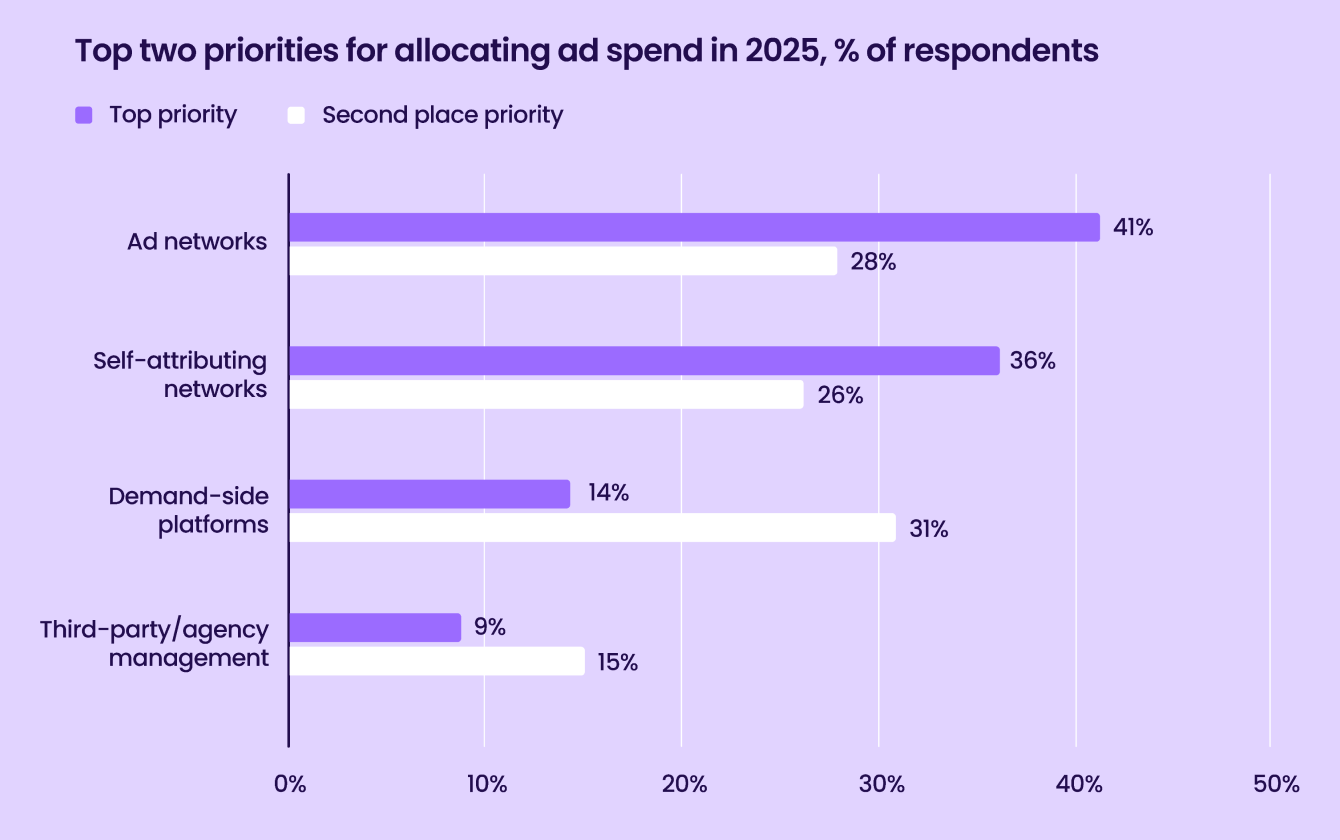
Over 70 percent of respondents cited either ad networks or self-attributing networks as their top priorities. While DSPs came in a distant third for top priority, 30 percent of respondents cited it as their second priority. Third-party or agency management came in last place for most respondents.
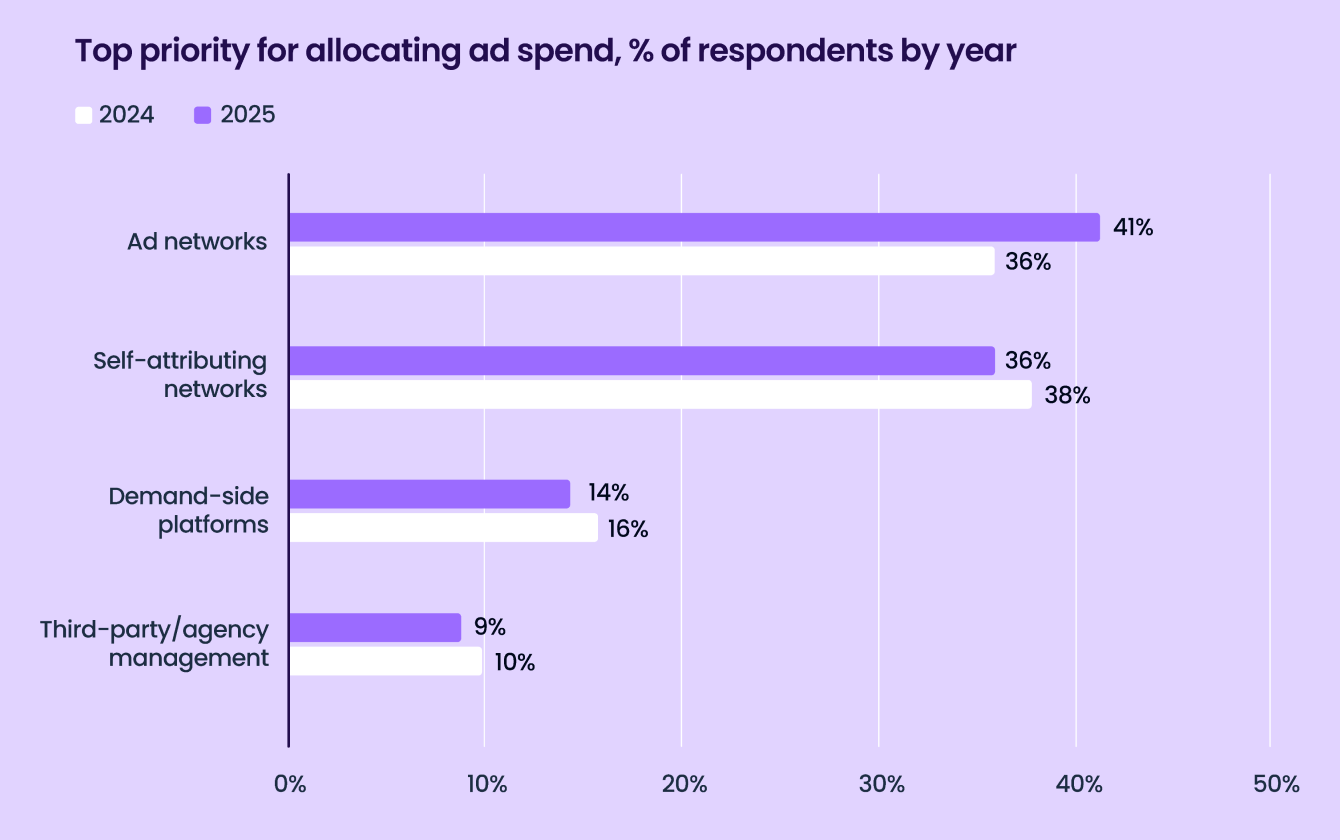
There have been minor shifts when comparing new responses to responses from 12 months ago. Ad networks gained five percentage points and now narrowly outrank self-attributing networks, the top priority for respondents in Liftoff’s 2024 survey.
Demand-side platforms are still the top priority for around 16 percent of respondents, and third-party/agency management still hovers at around 10 percent.
Over half of marketers plan to invest in organic social and influencer marketing
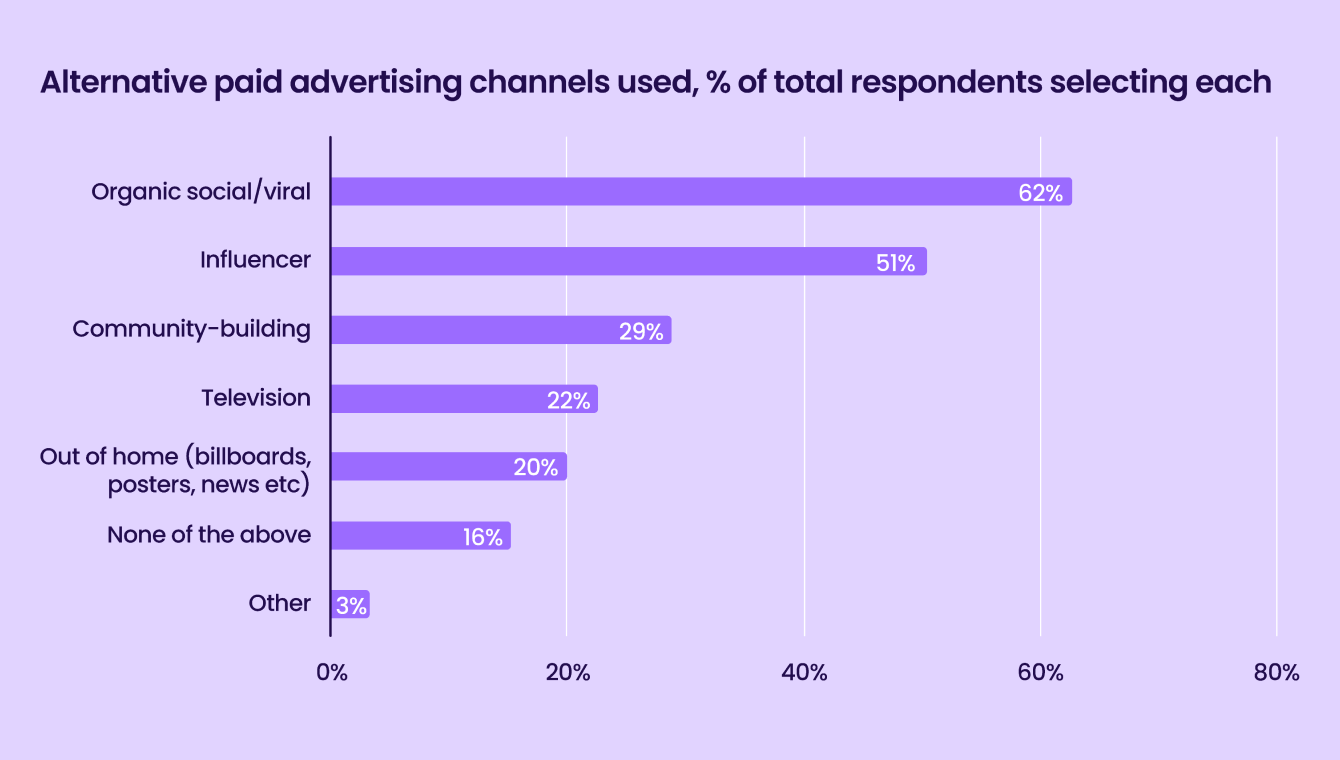
We also wanted to know where mobile marketers invest their resources outside mobile UA channels.
Over half of respondents plan to invest in influencer and organic channels, and a little less than a third plan to focus on community building. Television (including CTV) and out-of-home advertising were also cited by about 20 percent of respondents.
Most marketers were working with more partners in 2024
Looking at changes year-over-year, we see that marketers are now more open to working with new partners than they were one or two years ago.
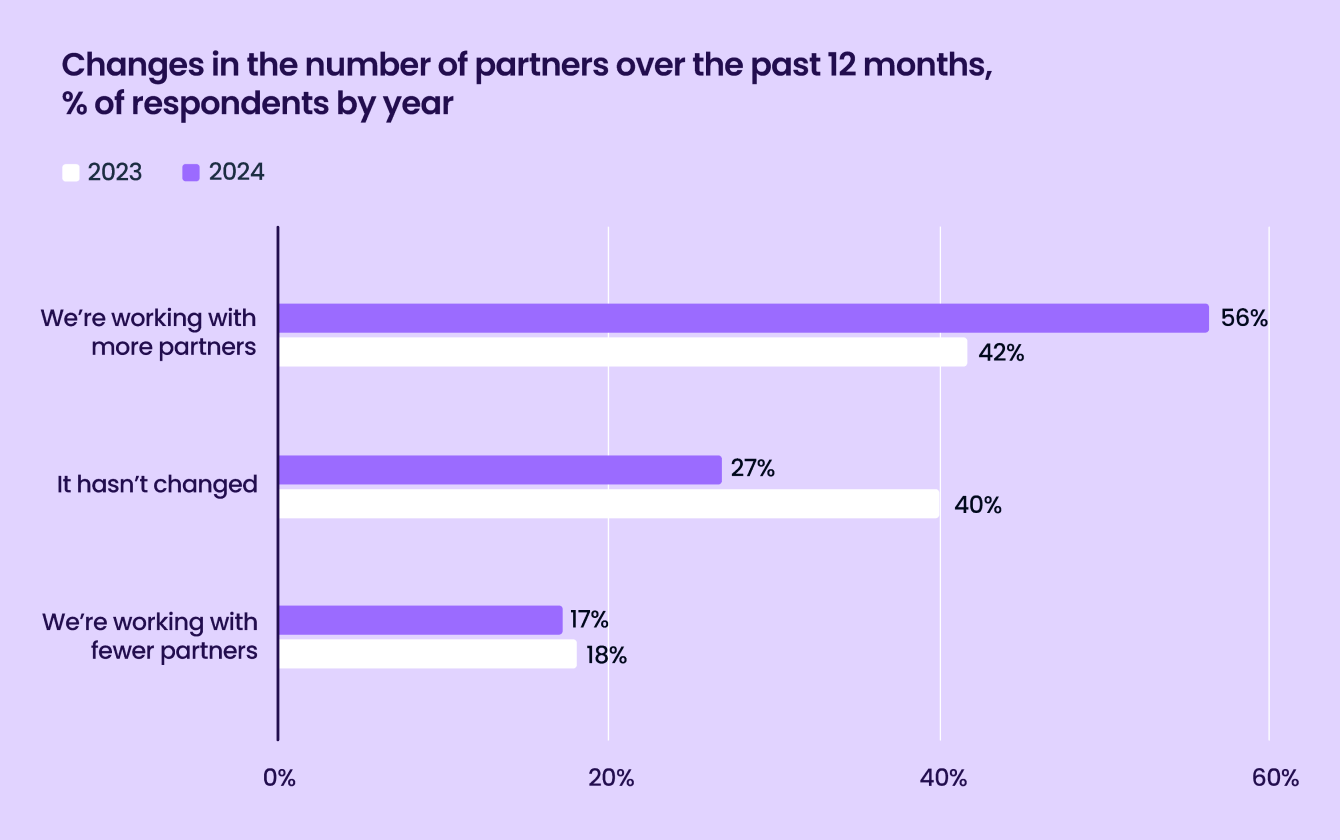
Compared to responses from 2023, 14 percent more respondents report working with more partners than before. Another 27 percent are working with the same number of partners, while only 17 percent are working with fewer partners.
For 74 percent of marketers, improving ROAS/ROI is a key motivation for exploring new ecosystem partners
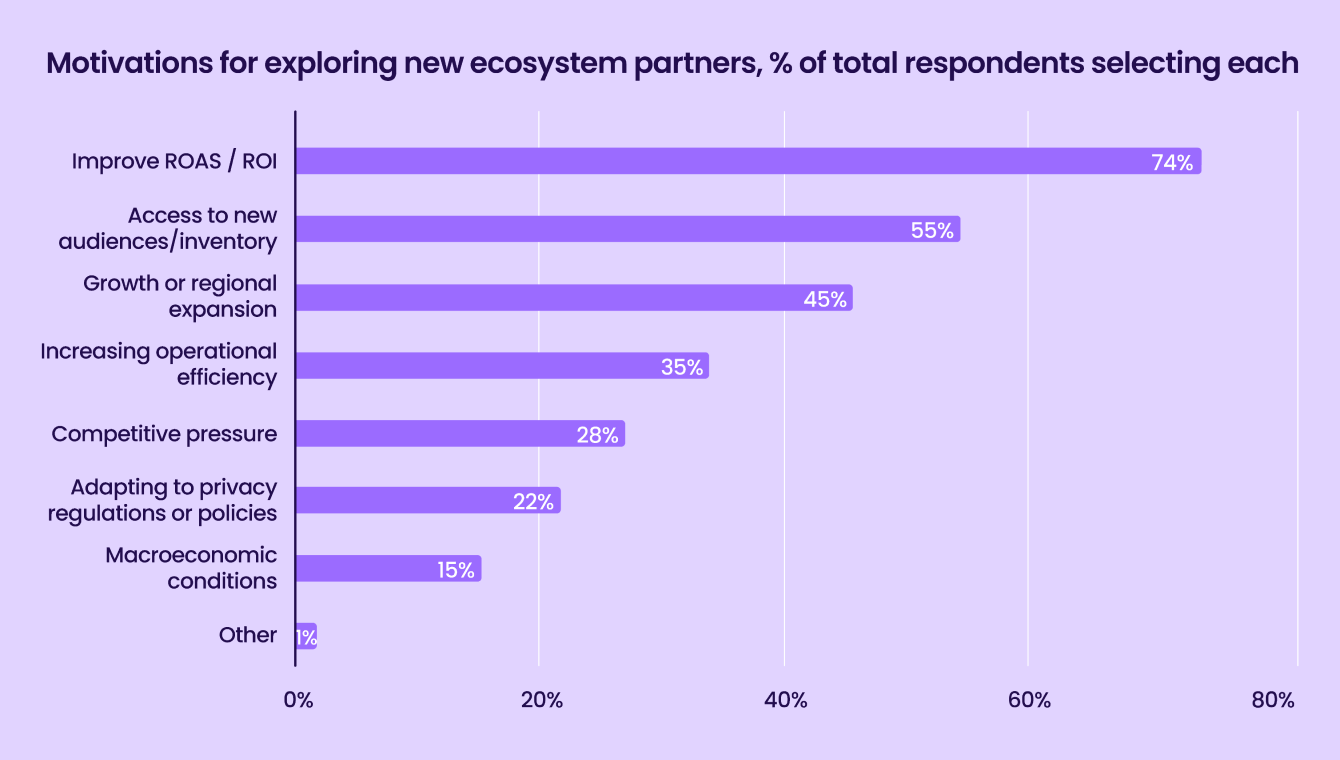
Mobile businesses engage new partners for a variety of reasons. We wanted to see the main factors impacting decision-making.
74 percent of survey respondents included improving ROAS/ROI as a key motivator for engaging new partners. Access to new audiences and inventory was also a crucial factor, with 55 percent including it in their list.
Environmental factors such as competitive pressures and privacy regulations are part of the equation but are less top-of-mind, with only 20-30 percent of respondents citing each as a factor. Only 15 percent cited new macroeconomic conditions as a factor.
Mobile marketing teams are collaborating more with data & analytics and product teams
Mobile businesses have become more data-driven and specialized, and what they demand from marketers in the industry is also changing.
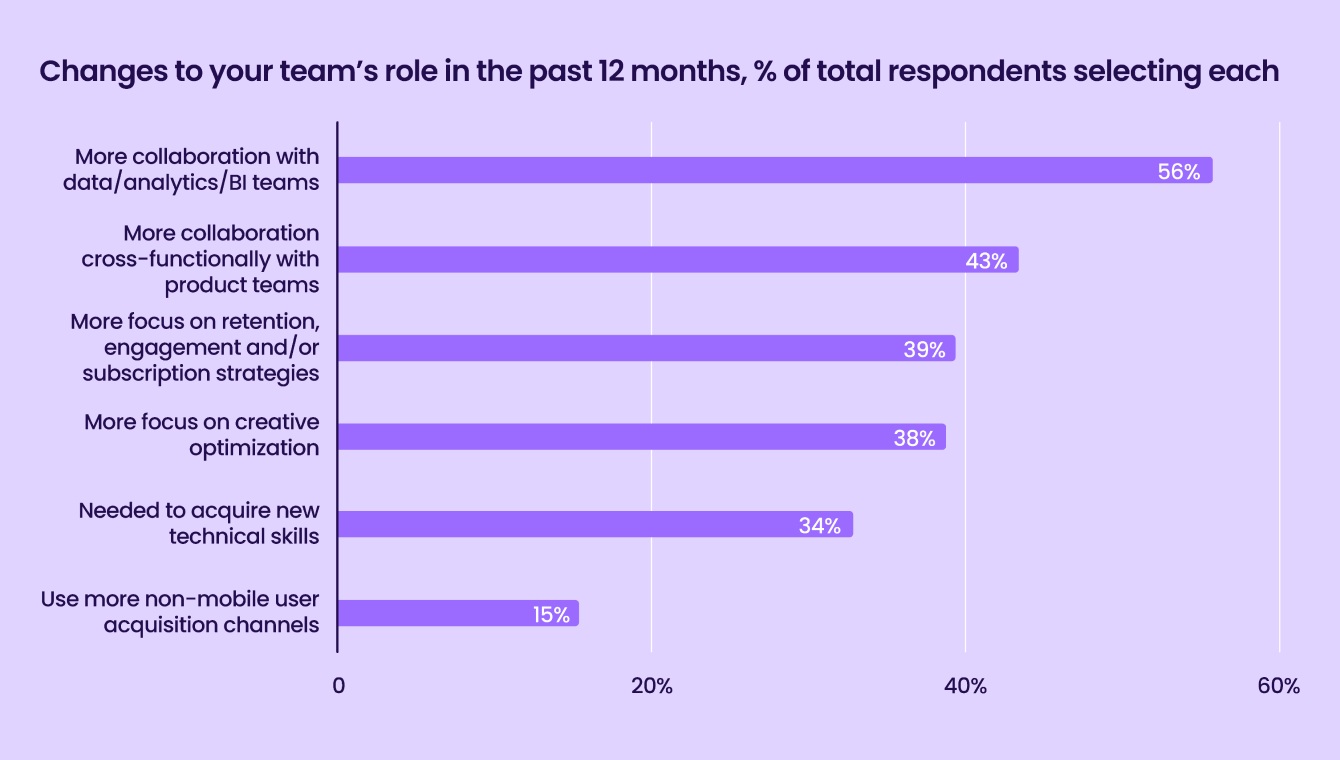
We asked survey respondents how their teams have changed in the last twelve months. Unsurprisingly, over half of respondents cite working more with data, analytics, and BI teams. 34 percent also mentioned that they or their team needed to acquire new technical skills 43 percent reported more work with product teams.
As markets become more saturated, businesses focus more on sustainable revenue strategies. 39 percent report focusing more on retention, engagement, and subscription strategies.
Only 15 percent have needed to explore more non-mobile user acquisition channels, likely an indication that mobile remains a unique channel. Taken together, this reflects the growing complexity and vital role of cross-organizational collaboration and goal alignment for app marketers.