Social Proof Emphasis in Puzzle & Lifestyle games wins video by 69%
Features-centric content wins 43% of Finance’s image spend and 41% of video
Shopping’s ‘Shop Now’ CTA rockets from 6% of video spend to 68% on image
Video and image are playing different games
Last year, this report described AI-driven creative production as a relentless numbers game: whoever generated the most variations, fastest, had the best odds of finding a winner. That premise still holds. If anything, the game has accelerated: production hasn’t slowed, and the advertisers already spending the most keep pulling further ahead.
Average creative counts at the top spend tier climbed 46% in a single year, while counts of advertisers with lower spend barely moved. Scale is compounding, not distributing, and the gap between well-funded and modestly funded creative teams keeps widening.
The gap between formats is not subtle either. Across gaming and non-gaming verticals alike, the attribute that drives the strongest video performance frequently reverses on static image ads: what reads as urgency in motion reads as noise in a frame, and the selling point that closes on one format falls flat on the other.
The two formats are also moving in opposite directions. Video’s top creatives are pulling further away from the pack, their share of spend climbing year over year, while image spend is spreading more evenly, the top creatives’ share easing over the same stretch.
That’s the real story underneath the numbers game: the volume advantage only compounds if it’s the right volume for the format it’s running in. The findings that follow — based on granular analysis of 1.2 million creative variations — show exactly where video and image diverge, and the one category where they still align.
How to read the ‘share of ad spend’ data
The data in this report shows how ad spend is split between creative types with multiple components. Since media platforms direct more budget to creatives that work, the share of spend is the best indication of creative performance.
The analysis compares video and static image ads, covering theme, hook, CTA, user generated content (UGC), gameplay, player motivation, and more — all identified by AppsFlyer’s AI-driven creative optimization engine, which automatically dissects numerous components of a creative to enable granular measurement for effective optimization.
* All results are based on fully anonymous and aggregated data. To ensure statistical validity, we follow strict volume thresholds and methodologies and only present data when these conditions are met.
** A creative variation is set when there is the same visual in the same orientation. Any change whether localization, color, word, with or without a logo etc gets its own creative ID. Creatives are deduped when there is the same visual in the same type of orientation (e.g. portrait variations will be deduped assuming no other change).
*** A creative element is a single, specific value tagged within a creative attribute, for example ‘Exciting’ within Creative Tone, or ‘Get Started’ within CTA Type
Growth in creative variations this year is concentrated above the $1M spend tier
Growth in the average number of creative variations this year concentrates almost entirely above the $1 million quarterly spend tier per app. From Q1 2025 to Q1 2026, Gaming’s ‘$7+ million’ bucket jumped 45%, hitting 3,977 average creative variations per app, while its ‘$4-$7 million’ and ‘$1-$4 million’ tiers grew a more modest 12% and 14%, to 1,213 and 887, respectively.
Non-gaming shows the same shape at a larger scale: ‘$7+ million’ climbed 47% to 3,477, ‘$4-$7 million’ rose 29% to 2,615, and ‘$1-$4 million’ grew 16% to 1,670. When combining gaming and non-gaming, the $7+ million count was 3,727 creatives.
In contrast, every tier below $1 million mostly flattened or pulled back in Gaming over the same year, and was far more mixed in non-gaming.
In this relentless numbers game, AI is why the biggest spenders can keep up. As generative and AI-assisted tools have moved from early adoption to default practice over the past year, the advertisers who already had the volume to justify testing more variations now also have the tooling to produce them at that scale and measure them effectively for rapid optimization.
Every marketer should be doing the same: a genuine creative winner is hard to come by, and the only way to consistently find one is to keep testing a wide, constantly refreshed set of variations and to analyze the content granularly and efficiently to make sense of the sheer volume of data.
The next section shows exactly why that volume matters: spend concentrates into a small slice of winning creatives, so the more variations tested, the better the odds of finding the next one.
Average creative variations per app by UA spend *
Gaming video ads concentrate spend into an ever-smaller slice of winners
These charts rank all creative variations by spend and show, at each cut point along that ranking, what share of total spend the creatives up to that point capture: across every vertical and format, the top 2% alone already account for roughly half of all spend or more, and by the top 10%, that share climbs past 75%. The remaining 90% of creatives split what little is left.
Gaming is the more concentrated of the two verticals on video, and it’s pulling further ahead: its top 2% climbed from 53.5% of spend in Q1 2025 to 60.7% in Q2 2026, a steeper rise than Non-gaming’s move from 44.1% to 49.1% over the same stretch. It’s possible Gaming campaigns lean harder into fewer proven creatives once a winner is found, since genre-specific hooks and mechanics don’t always transfer well across variations.
The more interesting split shows up between formats within Gaming itself: while video’s top 2% keeps climbing, image’s top 2% is actually easing, from 51.5% in Q1 2025 down to 46.6% by Q2 2026. Non-gaming shows no such divergence, its video and image top-2% shares rose in step over the same period. We can see that Gaming’s image creative is spreading spend across a slightly wider set of variations even as video keeps doubling down on fewer winners.
That concentration is the practical case for constant creative production. If only 2-10% of variations ever end up carrying the vast majority of the spend, most tests are misses by design, and there’s no real way to know in advance which one will land. The only way to consistently find that small share of winners is to build a process that can continuously produce a wide set of creatives, and then analyze and deploy them efficiently.
Cumulative share of spend by % of creative variations
Puzzle & Lifestyle games: ‘Benefit’ theme leads as ‘Social Proof Emphasis’ wins big on video
A look at the ‘Key Selling Proposition’ category shows that ‘Benefit’ leads on every channel for both video and image formats at roughly 47-61% of spend. That aligns with the genre: casual and lifestyle titles tend to sell better on the payoff itself, relief, progress, mastery, than on a feature list, so ‘Benefit’ reads as the safer bet regardless of channel.
‘Primary Filming Angle’ also leans ‘Eye level’ across the board, climbing to 64% on Social & Search image creatives – a natural, relatable POV that suits a casual audience better than a more stylized angle. ‘Close-up’ is the one angle that gains real ground specifically on image, though, reaching 30% of Ad Networks’ image spend versus under 2% on its video, so it’s worth testing there even while ‘Eye level’ holds the lead.
‘Social Proof Emphasis’ is an interesting case: ‘High’ emphasis wins video by a wide margin, 56-69% of spend across channels, but on image it barely registers, DSP’s ‘High’ share on image is just 3.2%, with ‘Low’ emphasis taking over instead, up to 80%. It’s possible a testimonial, review count, or “used by millions” cue needs motion or time on screen to land, and a still frame simply doesn’t have room to make the case.
The rest of the winners are more format-agnostic. ‘Visual Style’ leans ‘Animated’ everywhere, 70-93% of spend depending on channel and format. ‘Hook Type,’ a video-only concept since a still image has no opening moment, splits its top share between ‘Problem’ and ‘Gameplay’ hooks, but not evenly: Social & Search leans harder on ‘Gameplay’ as the hook (24.5%), while Ad Networks and DSP lean harder on ‘Problem’ (29% and 27.9%), suggesting the algorithmic channels may have found that framing a pain point up front outperforms leading with the loop itself.
‘CTA Type’ leans ‘Play Now’ everywhere, though its lead softens on image, where a lower-commitment ask like ‘Join’ picks up real share on Social & Search (17.7%), fitting a format that gets one glance rather than video’s sustained attention.
Share of ad spend in Puzzle & Lifestyle games by media type
Puzzle & Lifestyle creative examples
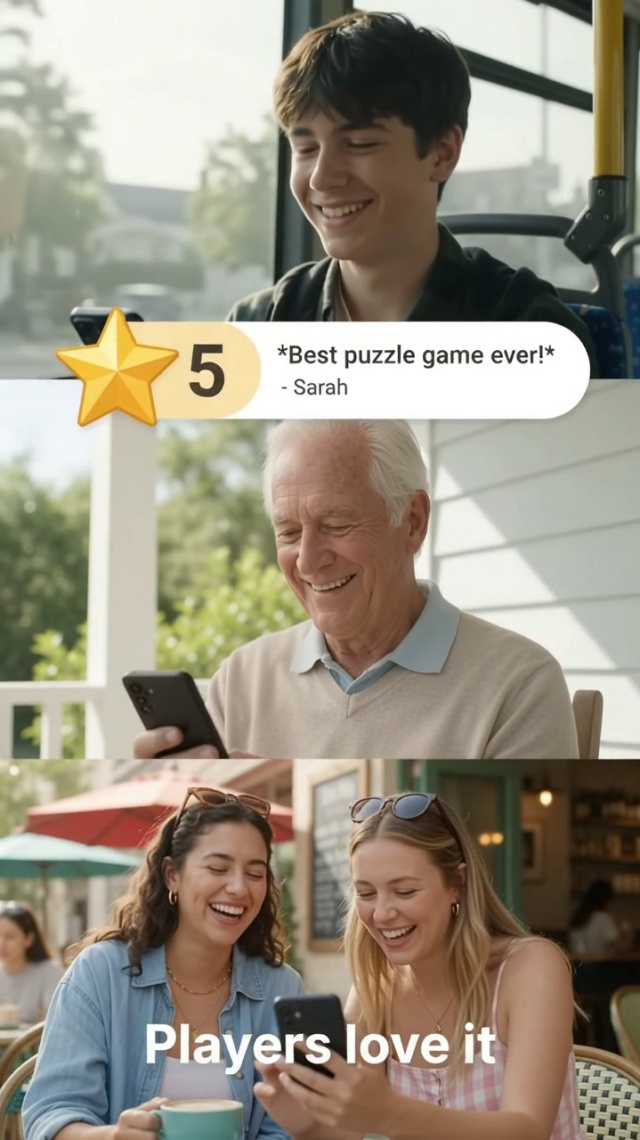
Social Proof Emphasis = High

Key selling proposition = Benefit
Action & Strategy games: ‘Exciting’ leads video, but on image, DSPs’ winner flips to ‘Dramatic’
‘Creative Tone’ shows a genuine reversal on one channel: ‘Exciting’ leads video everywhere, but on image, DSPs’ winning tone flips to ‘Dramatic’ (54.1% versus ‘Exciting’s’ 45.9%), the only case in this vertical where the video winner and the image winner for the same channel are different values entirely.
‘Content Approach’ shows the sharpest split between formats: video leans hard into ‘Gameplay,’ up to 47.9% of Ad Networks’ spend, while image flips to ‘Promotional,’ reaching 46.5% of DSPs’ image spend and 38.5% of Social & Search’s.
‘Key Selling Proposition’ is this vertical’s closest contest: ‘Benefit’ and ‘Feature’ run within a few points of each other on every channel and both formats, roughly 42-45% each on video. That’s a real departure from more benefit-led verticals, suggesting an Action & Strategy audience responds about as well to a feature callout as to an emotional payoff, so there’s no safe default here worth leaning on without testing both.
‘Player Motivation’ underscores that same channel-specific pattern. On video, ‘Progression’ wins for Social & Search and Ad Networks alike, though DSPs favor ‘Adrenaline’ instead (34.8%). On image, ‘Progression’ still leads for Social & Search and DSPs, but Ad Networks’ winning motivator jumps to ‘Adrenaline’ at 62.6%, more than double its video share of 25.2%. It’s possible a static shot lands better when it commits to one high-arousal cue rather than trying to convey a sense of progression, which usually needs movement to read.
Share of ad spend in Action & Strategy by media type
Action & Strategy creative examples

Creative tone = Exciting

Player motivation = Progression
Casino games: Win scenario dominates ‘Gameplay Outcome’ on video
‘Gameplay Outcome’ leans heavily toward ‘Win’: 83.2% of Ad Networks’ video spend and 58.6% of Social & Search’s. DSPs is the exception, where ‘No outcome’ leads at 59.7% over ‘Win’s’ 40.3%. ‘Lose’ barely registers anywhere, peaking at just 4.4% and disappearing entirely for the other two channels.
‘CTA Urgency’ is where Casino draws its clearest line between formats: ‘High’ urgency already leads every channel on video (55-64%), but on image it climbs close to saturation, 92.9% of Social & Search’s spend and 87.4% of DSPs’. It’s possible urgency reads as an easier sell once there’s no gameplay footage competing for attention, so the ad leans harder on pushing the click.
‘Visual Style’ leans ‘Animated’ everywhere in this vertical, but Ad Networks is the outlier on video, 64.3% versus 81-85% for the other two channels, with ‘Mixed’ (animated and live footage) picking up the rest of its share (35.7%). That gap closes on image, where Social & Search’s ‘Animated’ share climbs to 93.3%, suggesting the mixed-style approach is a video-specific experiment rather than something carried across formats.
‘Creative Tone’ shows a similar Social & Search divergence: while Ad Networks and DSPs lean almost entirely on ‘Exciting’ on video (85-87%), Social & Search gives real share to ‘Comedic’ instead (33%), nearly matching its own ‘Exciting’ share (62.3%). On image, Social & Search settles back toward ‘Exciting’ (78.9%), with ‘Cheerful’ taking the rest, so the comedic angle seems to be something that works better with motion.
‘Player Motivation’ produces the sharpest reversal on DSPs specifically: ‘Adrenaline’ leads its video spend (46.5%), but ‘Progression’ takes over on image (80.2%). It’s possible a moving shot sells the rush of a big win, while a still image works better selling the sense of climbing toward one.
Share of ad spend in Casino by media type
Casino creative examples
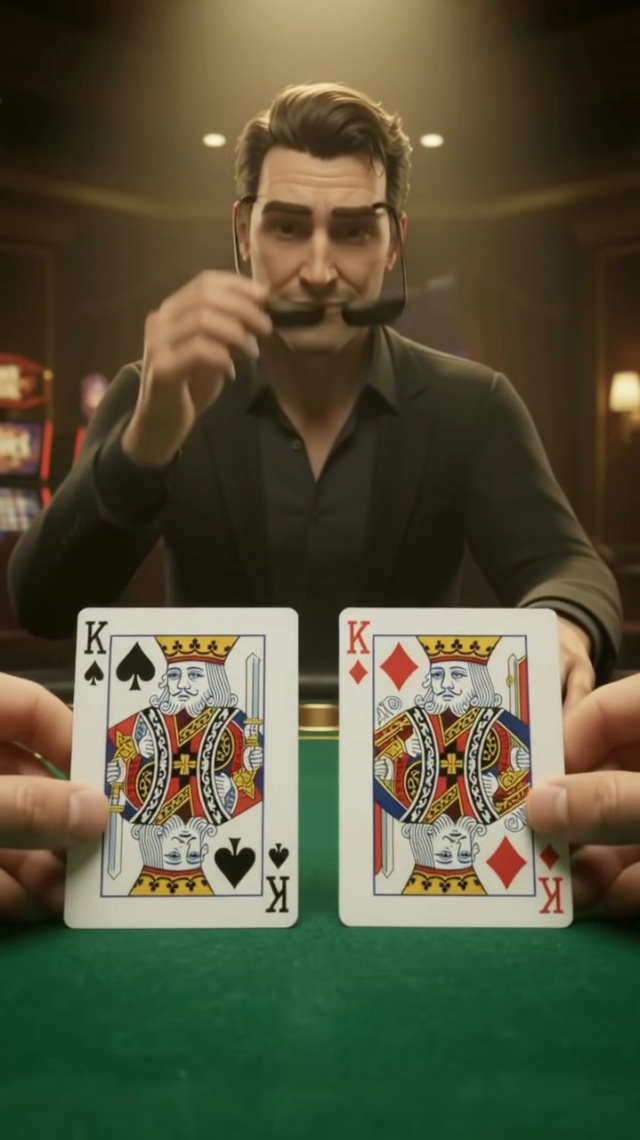
Gameplay outcome = Win

CTA urgency = High
Sports & Racing games: ‘CTA Urgency’ in video on Social & Search is ‘High’ (65%), but Ad Networks favor ‘Medium’
‘CTA Urgency’ shows a rare case where two channels disagree on video itself: Social & Search’s winning urgency is ‘High’ (65%), but Ad Networks’ video spend actually favors ‘Medium’ instead (52.4% versus 46.4%). It seems Ad Networks’ typically broader-reach placements call for a softer urgency cue than Social & Search’s more targeted inventory.
‘Creative Tone’ leans hard on ‘Exciting’ across the board, 69.3% of Social & Search’s video spend and 60.6% of Ad Networks’, and that lead only grows on image, climbing to 80.5% for Social & Search. ‘Comedic’ picks up real share on video, especially for Ad Networks (21.8% versus Social & Search’s 10.4%), but that channel gap doesn’t carry over once the format shifts to a still frame, where the options narrow back around ‘Exciting.’
‘Player Motivation’ on video has Ad Networks leaning toward a clear ‘Competition’ lead (32.8% versus ‘Adrenaline’s’ 21%), while Social & Search’s video audience is nearly split between the two, 25.9% ‘Adrenaline’ to 24.1% ‘Competition.’ Once the format switches to image, that near-tie resolves: Social & Search’s spend tips toward ‘Competition’ (33.9%), pulling further ahead of ‘Adrenaline’ (29.1%). It appears ‘Adrenaline’ relies on a sense of motion that only video can deliver, while a still frame reads more like a straightforward, head-to-head challenge.
Share of ad spend in Sports & Racing by media type
Sports & Racing creative examples

Player motivation = Competition

Creative tone = Exciting
Finance apps: ‘Informative’ hook tone leads video ahead of ‘Exciting’
‘Hook Tone’ stands out for what it favors: ‘Informative’ leads video for both Social & Search (35.9%) and DSPs (56.3%), ahead of ‘Exciting,’ which usually tops this attribute in other verticals. It seems a finance audience responds better to an opening that signals substance over energy.
‘Content Approach’ breaks from the pattern seen in most other verticals: ‘Features-centric’ wins on both video and image, and for both channels, rather than the format flip that shows up almost everywhere else, climbing slightly from 40.8% of Social & Search’s video spend to 43.2% on image. Finance’s buyers appear to want the same feature-forward pitch regardless of format, a more stable creative bet than most verticals allow.
‘Hook Emotional Trigger’ shows the widest channel gap in this vertical: DSPs concentrate an unusually large 83.2% of video spend on ‘Anticipation’ alone, while Social & Search spreads its spend more evenly across ‘Anticipation,’ ‘Trust,’ ‘Frustration,’ and ‘Happiness.’ One explanation is that DSPs’ more algorithmic buying rewards a single, proven emotional trigger once it starts converting, while Social & Search’s audience still responds to a wider variety of approaches.
‘CTA Incentive’ splits sharply by channel on video: DSPs lean hard on ‘Reward’ (50%), while Social & Search favors ‘Discount’ instead (28.5%), with ‘Reward’ barely in its top tier (13.7%). On image, that gap widens further: Social & Search’s ‘Discount’ climbs to 36.7% while ‘Reward’ fades to just 9.1%. It seems a straightforward discount is an easier, lower-commitment offer to convey on a static ad than a reward that may need more context to land.
Share of ad spend in Finance by media type
Finance creative examples
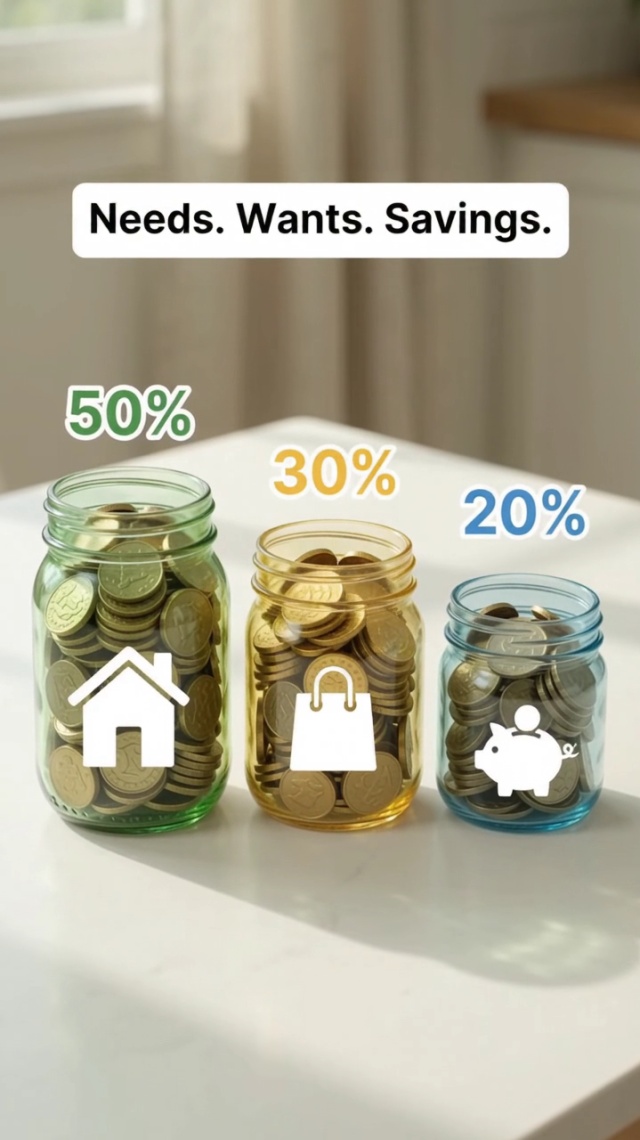
Content approach = Features-centric

Primary filming angle = Eye-level
Shopping apps: ‘Users endorsement’ wins video, ‘Promotional’ takes over image
‘Content Approach’ produces a clean reversal: ‘Users endorsement’ wins video at 38.1% of spend, narrowly ahead of ‘Features-centric’ (32.1%), but that value doesn’t lead on image at all. There, ‘Promotional’ takes over instead, climbing to 47.7%. It seems a testimonial-style pitch works better with the time and context video provides, while a still image leans on a more direct, offer-first pitch.
‘CTA Type’ flips from a fragmented field on video, where ‘Download’ narrowly leads at 29.2%, to a clear winner on image: ‘Shop Now’ jumps from just 6.4% of video spend to 67.8% on image, becoming the dominant call to action once the format shifts to a still frame. It seems a fast, transactional CTA reads better as a single, immediate ask than as one of several options competing for attention in motion.
‘Social Proof Emphasis’ shows the sharpest reversal of any attribute in this dashboard: ‘High’ emphasis takes 84.9% of video spend, but on image, ‘Low’ emphasis wins instead at 70.1%, with ‘High’ dropping to just 29.9%. Whatever makes a testimonial or review count land on video, it clearly doesn’t translate to a still frame the same way.
Share of ad spend in Shopping by media type
Shopping creative examples
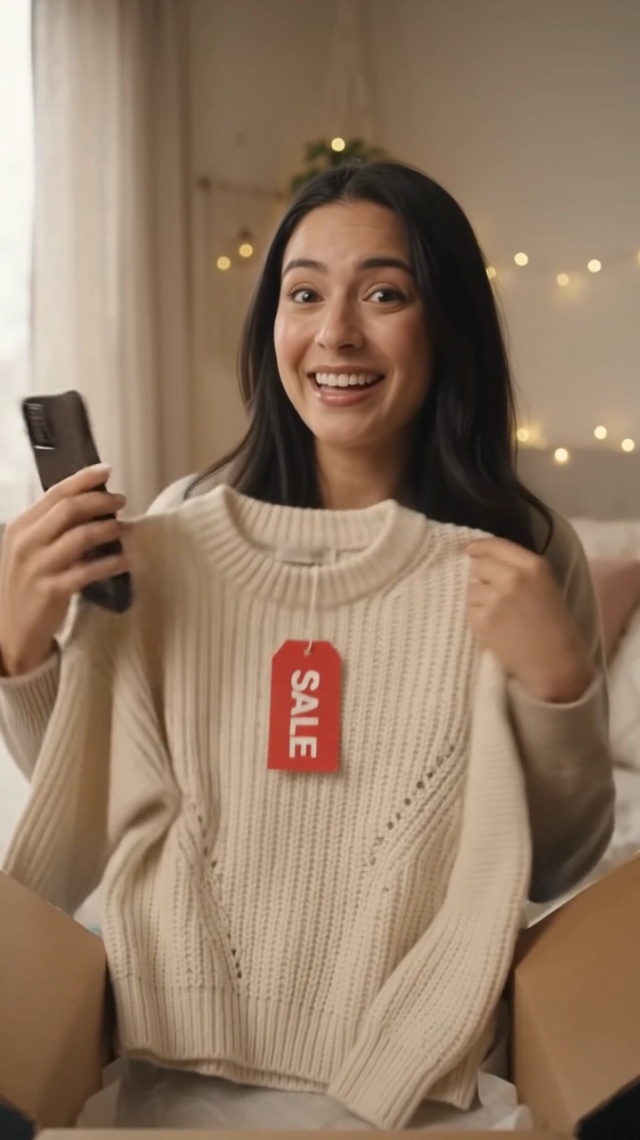
CTA type = Shop Now

CTA incentive = Reward
Media & Ent. apps: UGC wins video, polished and softer CTAs win image
Media & Entertainment’s real split lives almost entirely on Social & Search, so every comparison here is within that one channel rather than across several. ‘Has UGC’ produces the cleanest reversal in the data: user-generated-style content wins video overwhelmingly, 90.8% of spend marked ‘TRUE,’ but on image that flips hard, with 68.3% of spend marked ‘FALSE’ instead. It seems a raw, UGC-style clip reads as more authentic in motion, while a still frame benefits more from a cleaner, more produced look.
‘Animation Type’ tells a related but softer story: ‘No animation’ already edges out ‘Stylized’ on video (51.5% versus 47.2%), and that lead widens on image to 65.4%. An unstyled, real-footage look seems to hold up better than an animated treatment in this vertical, and even more so once the format loses motion.
‘Hook Audio Type’ rounds out the picture on video, where ‘Music’ leads at 40.9%, just ahead of ‘Voiceover’ (30.1%) and ‘Sound Effects’ (29%), a closer three-way split than either of the winners above.
‘CTA Type’ shows the sharpest reversal of the three: ‘Download’ dominates video at 49.6% of spend, but that same value doesn’t lead image at all. There, ‘Get Started’ takes over instead, climbing from a minor 12% on video to 38% on image, with ‘Join’ holding a similar share on both formats. A direct download appears to be an easier ask once a viewer has already watched footage, while a still image leans on a softer, more open-ended invitation instead.
Share of ad spend in Media & Entertainment by media type
Media & Entertainment creative examples
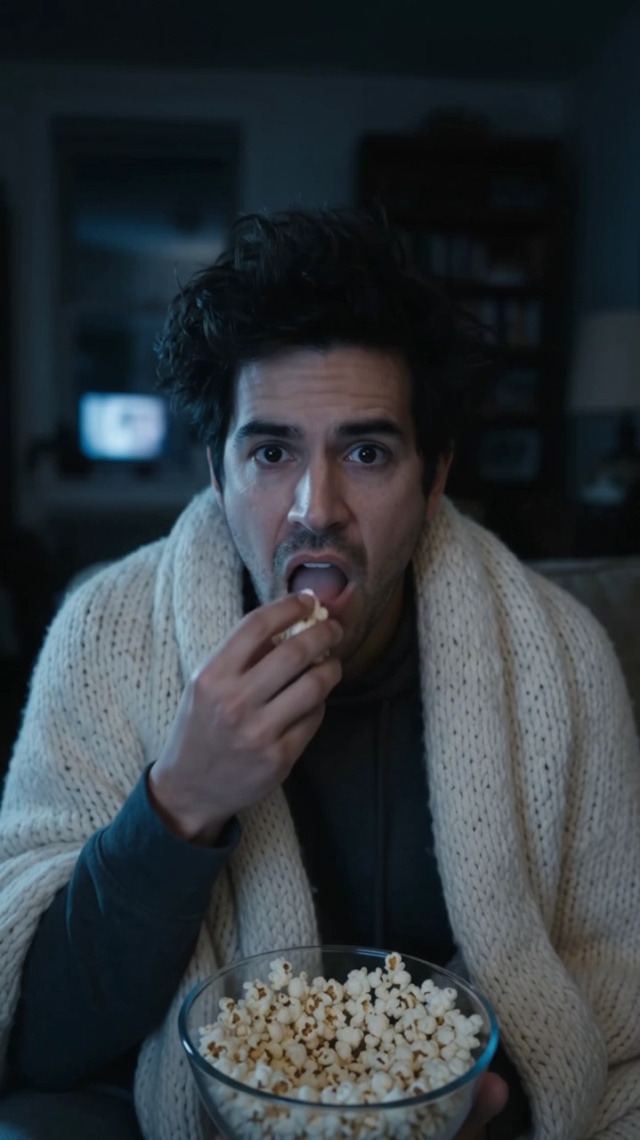
Has UGC = TRUE

Creative tone = Cheerful
Software apps: Social & Search’s top CTA is ‘Get Started’ as Ad Networks favor ‘Download’
‘CTA Type’ shows a rare case where channels disagree on video itself: Social & Search’s winning CTA is ‘Get Started’ (46.1%), while Ad Networks’ video spend favors ‘Download’ instead (48.4%). On image, Social & Search’s ‘Get Started’ pulls even further ahead, climbing to 65.5% of spend. It seems a broader, less specific call to action works better once a viewer has already watched footage explaining what the app does.
‘Hook Audio Type’ is close to a toss-up for Social & Search, where ‘Music’ (42.6%) and ‘Voiceover’ (39.6%) run nearly even, but Ad Networks’ video spend leans more decisively toward ‘Music’ (48.1%), with ‘Sound Effects’ a clear second (33.3%). One explanation is that Ad Networks’ broader-reach placements favor a hook that doesn’t rely on language, while Social & Search’s more targeted audience can support a spoken opening just as well.
‘Hook Type’ leans harder into a single approach than in most other verticals: ‘Problem’ accounts for 68.6% of video spend, well ahead of ‘Question’ (18.5%). It seems Software’s pitch works best by naming a pain point up front, rather than opening with a hook built around curiosity or a demonstration.
‘Visual Style’ produces one of the more unusual winners in the dashboard: ‘Mixed’ style takes 70.7% of video spend, well ahead of ‘Live footage’ (23.9%) and ‘Animated’ (5.4%), a value that rarely leads elsewhere. On image, that flips entirely: ‘Animated’ jumps to 64.2% while ‘Mixed’ falls back to 11.5%. It seems a blended, multi-shot video keeps a software product demo feeling dynamic without the cost of full animation, but a single still frame needs a more deliberate illustrated treatment to hold attention on its own.
Share of ad spend in Software by media type
Software creative examples
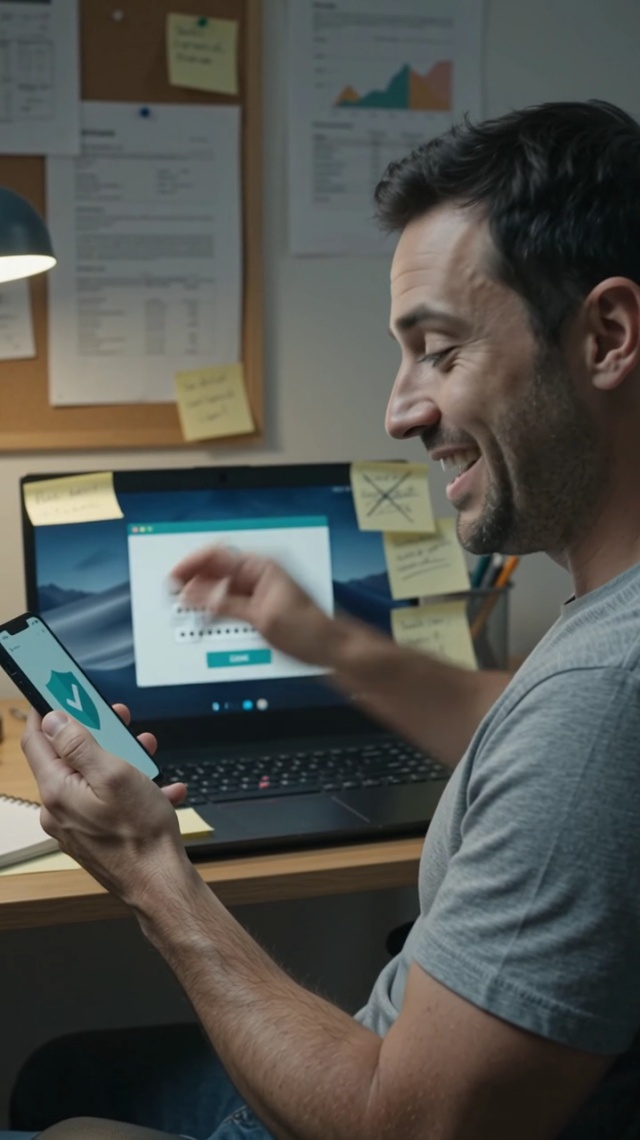
Hook type = Problem
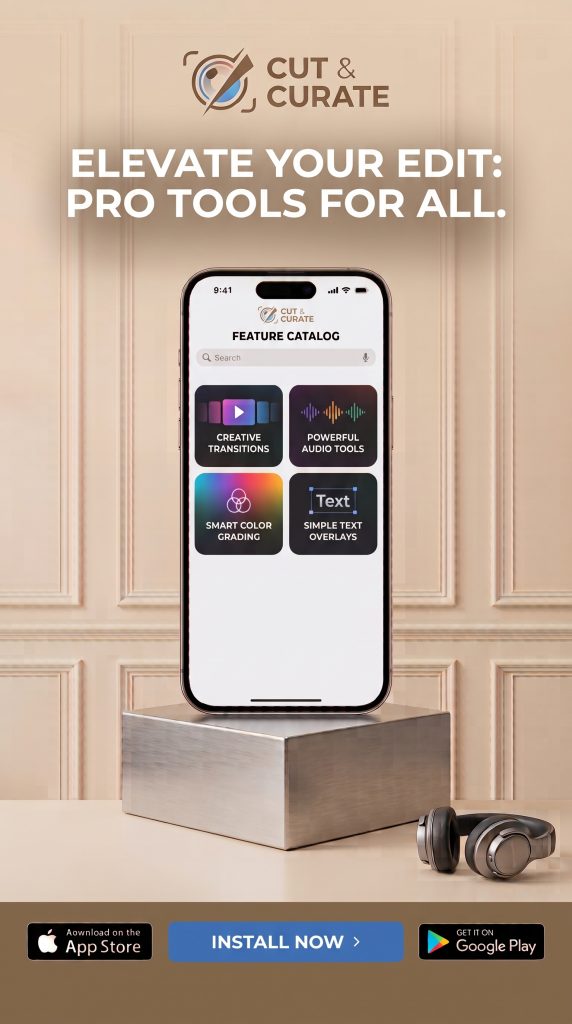
Content approach = Features-centric
Food & Drink apps: ‘Benefit’, ‘Convenience’, and ‘Price’ split almost evenly as ‘Key Selling Proposition’
‘Key Selling Proposition’ shows the closest three-way contest in the dashboard: ‘Benefit’ (33.5%), ‘Convenience’ (32.5%), and ‘Price’ (27%) all sit within a few points of each other on video, and that near-tie carries over to image too. Unlike most other verticals, there’s no safe default value here to lean on regardless of format.
‘Content Approach’ starts as a genuinely close race on video: ‘Promotional’ edges out ‘Narrative-driven’ (21%), ‘Features-centric’ (20.3%), and ‘Users endorsement’ (18.8%) by only a few points, with no clear standout. On image, that spread narrows sharply: ‘Promotional’ pulls ahead to 54.1% of spend. It seems a still frame rewards committing to one clear offer, where a video has enough time to let several different pitches share the spotlight.
‘Visual Style’ picks a winner that rarely leads elsewhere: ‘Live footage’ takes 75.7% of video spend, the strongest single-value dominance of any attribute in this vertical, and it stays the leader on image too, though its share eases to 58.7% as ‘Mixed’ picks up real ground (30%). It seems real, unstyled footage of food and drink carries more appeal than an animated or stylized treatment, in a way that doesn’t hold for most other categories.
Share of ad spend in Food & Drink by media type
Food & Drink creative examples

Key selling proposition = Convenience

Key selling proposition = Price
Travel & Tourism apps: ‘Features-centric’ wins video at 39%, but on image ‘Promotional’ rules with 56%
‘Content Approach’ shows a similar reversal: ‘Features-centric’ wins video at 39.3%, but on image ‘Promotional’ takes over completely, more than doubling to 56.4% of spend while ‘Features-centric’ drops to 22%. A still frame appears to favor a direct offer over a list of features that video has more room to walk through.
‘Key Selling Proposition’ flips outright: ‘Benefit’ narrowly wins video (37.3%) over ‘Price’ (32.7%), but on image ‘Price’ takes over instead, climbing to 47.2% while ‘Benefit’ falls to 24.3%. It seems a still image works better leading with a concrete number than an emotional payoff, which needs more room to land.
‘Hook Tone’ picks a different leader than most other verticals: ‘Cheerful’ tops video spend at 28.5%, ahead of ‘Exciting’ (20.3%) and ‘Dramatic’ (15.6%), a lighter opening tone than the more common Exciting-led pattern seen elsewhere.
‘CTA Incentive’ leans overwhelmingly on ‘Discount’ on video, 76.8% of spend, and it stays the winner on image too, though its share eases to 62.4% as ‘Limited_Offer’ picks up real ground, climbing to 27.6% from just 8.7% on video. A discount appears to be the safe default here regardless of format, even as a secondary incentive gains some room on a still frame.
Share of ad spend in Travel & Tourism by media type
Travel & Tourism creative examples

CTA incentive = Discount

Creative tone = Exciting
Average creative counts at the $7M+ spend tier climbed 46% this year while smaller advertisers barely moved, and AI-assisted production and analysis is largely what's driving that gap. Advertisers without top-tier budgets should explore AI-assisted variation tools to keep testing volume competitive, rather than treating testing pace as fixed to spend size.
In nearly every vertical this report covers, the creative attribute that wins on video is not the one that wins on a still image. Evaluate the two formats separately rather than assuming a single winning direction transfers, and budget testing time for each independently.
Video's top 2% of creatives now capture 61% of spend, up from 53% a year ago, while image's top 2% share eased from 51.5% to 46.6% over the same stretch. As such, doubling down on analysis is key to finding success, especially in video.
A single attribute can significantly swing spend share, which is why measuring performance down to the individual component, not just the overall ad, matters more than ever. As creative volume climbs, more data means more noise, not more clarity, and the full picture only emerges once you see which components combine into a winner.
Attribute-level analysis throughout this report shows that both surface elements, like CTA wording and visual style, and deeper psychological drivers, like emotional triggers and player motivation, can each swing performance significantly.
The videos and static image ads in this report were generated with the assistance of AI tools solely for illustrative purposes. They do not accurately depict any real person, place, or event but is an original artwork produced by artificial intelligence based on descriptive prompts. Any resemblance to actual individuals, living or deceased, or specific locations is purely coincidental. The content does not imply any endorsement, association, or connection with any natural persons or entities unless expressly stated therein.


